"How to Set Up NPS Surveys on Shopify (With Examples)"
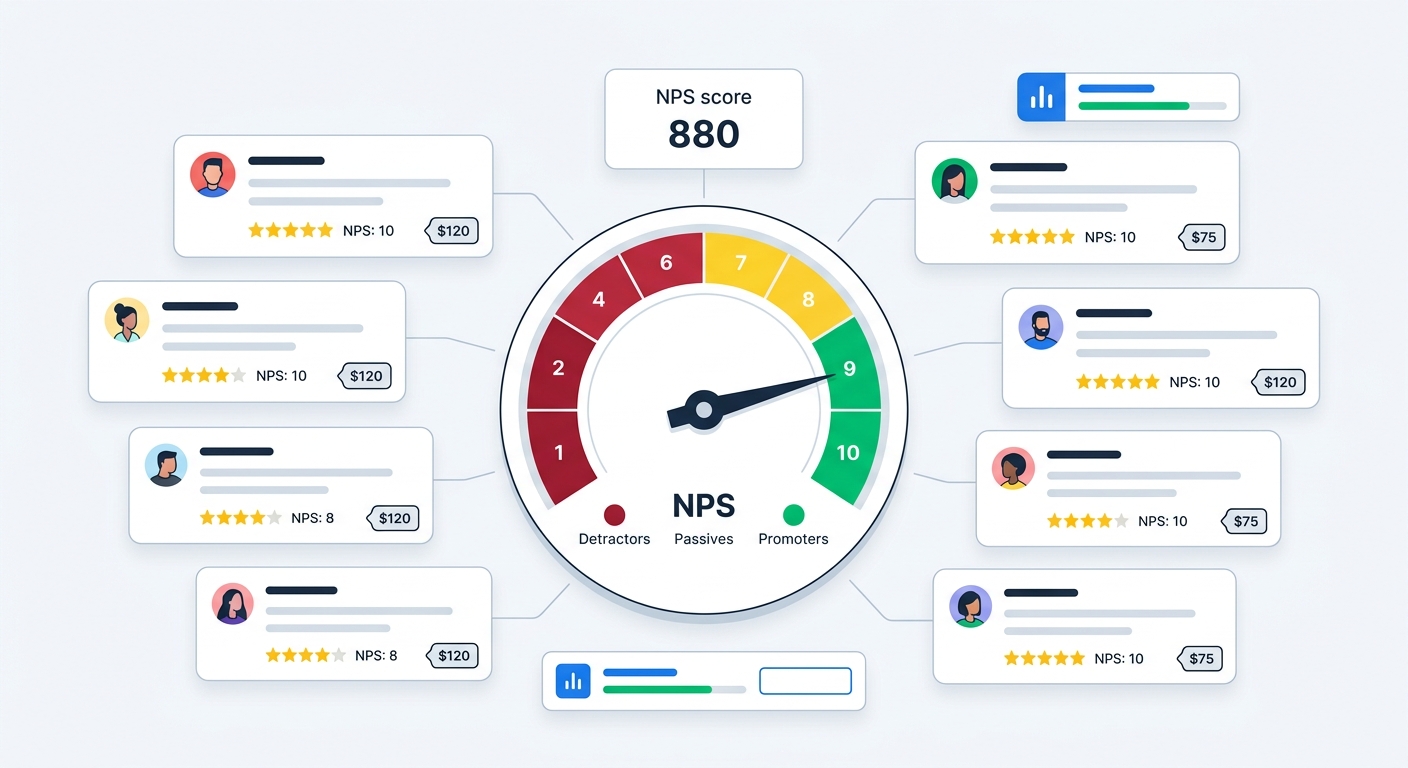
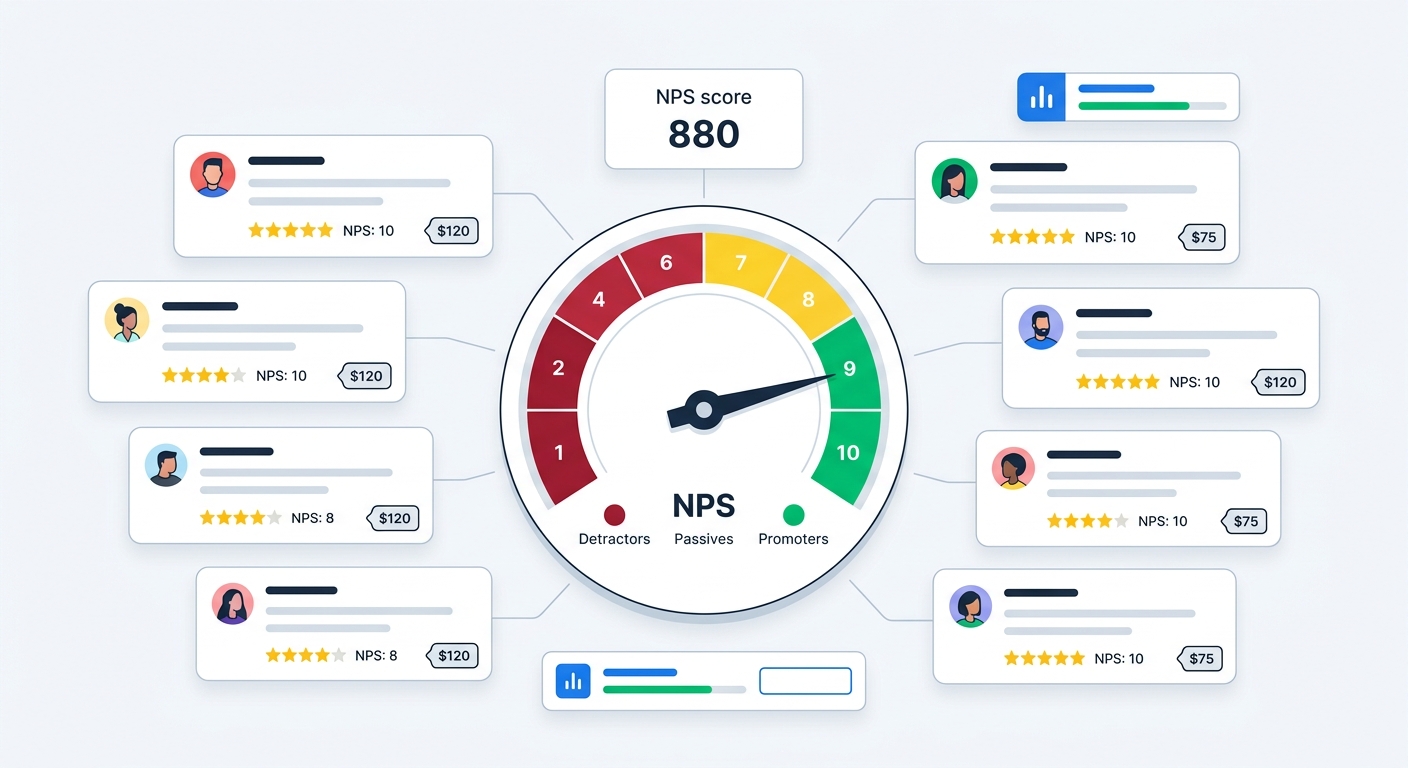
Net Promoter Score measures one thing: would your customers recommend you? It's a single question on a 0-10 scale, and it splits your customer base into three groups that behave very differently. Promoters (9-10) buy more, refer friends, and forgive mistakes. Detractors (0-6) churn faster, cost more to support, and tell people to shop elsewhere. Passives (7-8) are up for grabs.
Most Shopify stores either don't measure NPS at all or measure it and do nothing with the data. Both are missed opportunities. When you connect NPS scores to actual order data, you stop guessing which customers matter most and start seeing exactly how satisfaction translates to revenue.
This guide walks through setting up NPS surveys on Shopify from scratch: choosing the right timing, configuring the survey, segmenting responses, and using revenue-aware analytics to make NPS actionable.
What NPS actually measures (and what it doesn't)
NPS asks: "On a scale of 0-10, how likely are you to recommend [your store] to a friend or colleague?"
The scoring splits responses into three groups:
- Promoters (9-10): Loyal enthusiasts who keep buying and refer others
- Passives (7-8): Satisfied but unenthusiastic customers vulnerable to competitors
- Detractors (0-6): Unhappy customers who can damage your brand through negative word of mouth
Your NPS score is calculated as: % Promoters minus % Detractors. A score of 50 means you have 50 percentage points more promoters than detractors. Anything above 0 is technically positive. Above 50 is excellent. Above 70 is world-class.
What NPS tells you: Overall customer sentiment, loyalty trends over time, and which customer segments are most and least satisfied. It's a leading indicator of retention and organic growth.
What NPS doesn't tell you: Why customers feel the way they do. A score of 6 tells you someone is unhappy. It doesn't tell you whether the problem is product quality, shipping speed, pricing, or customer service. That's why the follow-up question matters more than the score itself.
Why standard NPS is incomplete for ecommerce
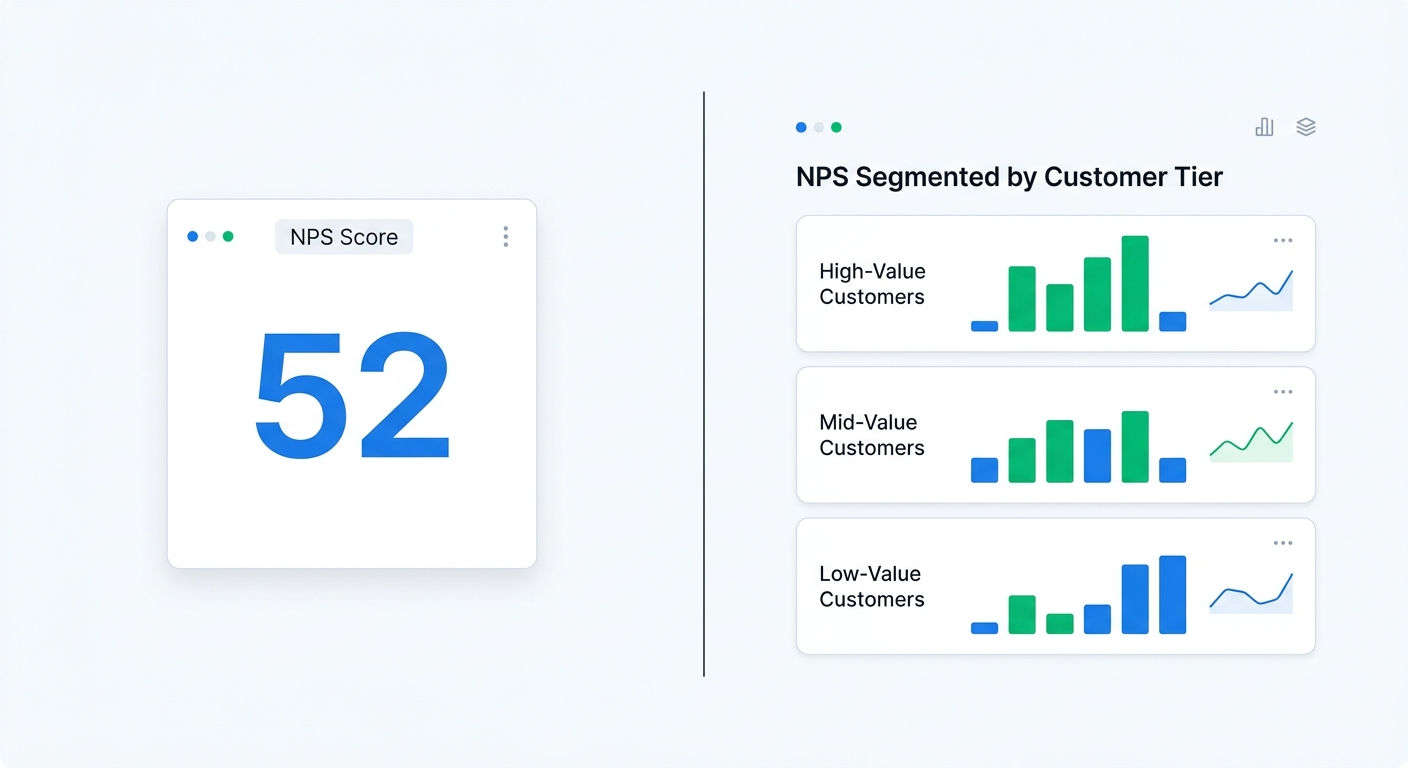
Traditional NPS treats every response equally. A detractor who spent $15 on a single impulse purchase gets the same weight as a detractor who spent $500 and was expected to become a repeat buyer. That's a problem.
Ecommerce NPS becomes genuinely useful when you link scores to revenue data. Revenue-aware NPS analytics connect each survey response to the customer's order value, purchase history, and lifetime value. This changes the analysis completely.
Consider two scenarios:
Scenario A: Your NPS is 45. Looks solid. But when you segment by revenue, your highest-spending customers (top 20% by AOV) have an NPS of 22. Your best customers are significantly less satisfied than your average customer. That's a retention crisis hiding behind a decent headline number.
Scenario B: Your NPS is 30. Looks mediocre. But your high-AOV customers have an NPS of 65 and your detractors are almost entirely one-time buyers who purchased discounted items. Your core business is healthy. The headline number was misleading.
Without revenue context, you'd panic about Scenario B and feel comfortable about Scenario A. With revenue context, you know exactly where to focus.
When to send NPS surveys on Shopify
Timing determines both the quality of your data and your response rates. Send too early and the customer hasn't formed a real opinion. Send too late and they've forgotten the experience.
7-14 days after delivery
This is the sweet spot for most Shopify stores. The customer has received the product, unboxed it, and used it at least a few times. Their opinion is real but the experience is still fresh.
Best for: First-purchase NPS, product satisfaction measurement, identifying early detractors before they churn.
Response rates: 15-25% for email-triggered surveys at this timing.
30 days after delivery
Use this timing for products that take longer to evaluate: skincare, supplements, fitness equipment, subscription boxes. The customer needs time to see results before they can honestly rate their likelihood to recommend.
Best for: Products with delayed value realization, subscription businesses measuring ongoing satisfaction.
Post-support interaction
Trigger an NPS survey after a customer service interaction to measure support quality separately from product quality. This helps isolate whether satisfaction issues stem from the product itself or from the experience around it.
Recurring quarterly or biannual
For repeat customers, send NPS surveys on a regular cadence to track satisfaction over time. This reveals whether your improvements are working and catches satisfaction declines before they become churn.
Important: Don't over-survey. One NPS survey per customer per quarter is plenty. More than that and you'll train customers to ignore your emails. For guidance on balancing survey frequency, see our complete guide to Shopify post-purchase surveys.
Setting up NPS surveys on Shopify: step by step
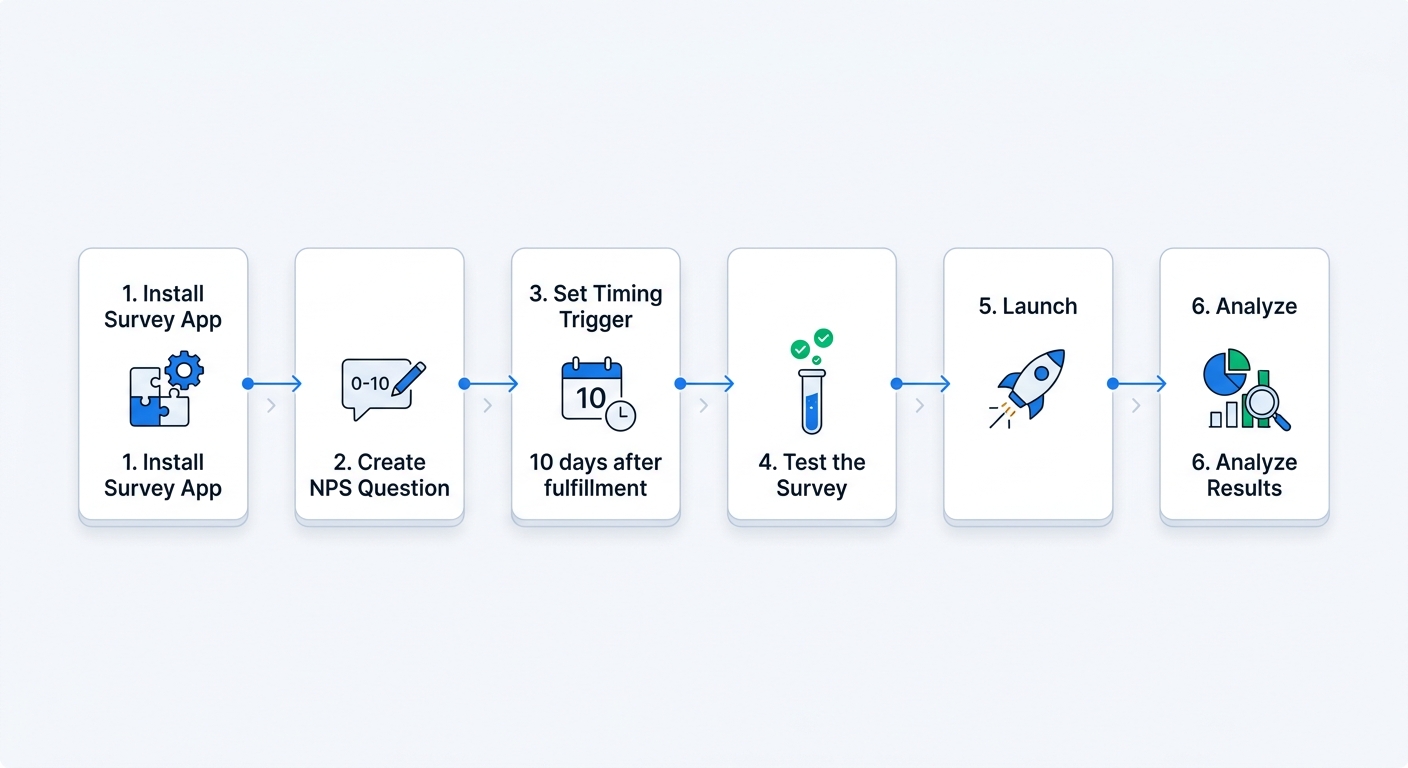
Step 1: Choose your survey tool
You need an app that supports NPS surveys with Shopify integration. Key requirements:
- NPS-specific survey type with 0-10 scale and automatic segment classification
- Shopify order data integration so responses connect to purchase information
- Follow-up question support for capturing qualitative feedback after the score
- Automated email triggers based on fulfillment events
- Revenue-aware analytics that link NPS segments to spending data
UserLoop covers all of these. It handles NPS alongside six other survey types (checkout, popup, email, link, app block, and video), so you don't need separate tools for different feedback needs.
Step 2: Create your NPS survey
Configure the survey with these elements:
The core question: "How likely are you to recommend [Your Store Name] to a friend?" with a 0-10 scale. Keep the standard NPS wording. It's standardized for a reason: it lets you benchmark against industry data.
The follow-up question: This is where the real value lives. After the customer selects their score, show a conditional follow-up:
- For Promoters (9-10): "What do you love most about us?"
- For Passives (7-8): "What would make your experience better?"
- For Detractors (0-6): "We're sorry to hear that. What went wrong?"
These conditional follow-ups produce dramatically better qualitative data than a generic "Tell us more" because they match the customer's emotional state.
Design: Match your store's branding. Use your brand colors, fonts, and tone of voice. The survey should feel like a natural extension of your store, not a third-party tool.
Step 3: Configure the trigger
Set the survey to send automatically based on Shopify fulfillment events:
- Trigger event: Order fulfilled (or delivered, if your shipping provider supports delivery confirmation)
- Delay: 7-14 days after the trigger event
- Audience: All customers, or segment by first-time vs. repeat buyers for separate tracking
- Frequency cap: Maximum one NPS survey per customer per 90 days
Step 4: Test before launching
Send a test survey to yourself or your team. Check:
- Does the email render correctly on mobile?
- Does the 0-10 scale display properly?
- Does the conditional follow-up appear after selecting a score?
- Does the response link back to the correct order in your dashboard?
- Is the survey experience under 30 seconds to complete?
Step 5: Launch and monitor
Enable the survey flow. For the first week, check daily:
- Delivery rate: Are emails reaching inboxes? Check for bounce rates or spam issues.
- Open rate: Aim for 30%+ open rates. If lower, test your subject line.
- Response rate: Aim for 15-25%. If lower, review your email design and timing.
- Score distribution: Are responses clustering as expected, or is something off?
NPS survey examples for Shopify stores
Here are specific NPS implementations across different Shopify store types, with the exact questions and timing that work.
Direct-to-consumer apparel
Timing: 10 days after delivery (enough time to try on and wash)
Core question: "How likely are you to recommend [Brand] to a friend?"
Follow-ups:
- Promoters: "What do you love most? (fit, quality, style, something else?)"
- Detractors: "What disappointed you? (fit, quality, shipping, something else?)"
Why it works: Apparel has high return rates and fit issues. Detractor follow-ups that mention "fit" specifically prompt customers to give actionable feedback instead of vague complaints.
Subscription boxes
Timing: 5 days after delivery of each box (shorter window because satisfaction is time-sensitive)
Core question: "How likely are you to recommend [Brand] to a friend based on this month's box?"
Follow-ups:
- Promoters: "Which item was your favorite this month?"
- Passives: "What would make next month's box perfect for you?"
- Detractors: "What items didn't work for you?"
Why it works: Monthly tracking reveals satisfaction trends. A dropping NPS over three months signals churn risk before cancellations actually happen.
Health and wellness products
Timing: 30 days after delivery (products need time to show results)
Core question: "Now that you've been using [Product] for a month, how likely are you to recommend it?"
Follow-ups:
- Promoters: "What results have you noticed?"
- Detractors: "What results were you expecting that you haven't seen?"
Why it works: Longer evaluation periods produce more honest scores. A day-7 survey for a skincare product would mostly measure packaging excitement, not product satisfaction.
High-ticket electronics or furniture
Timing: 14 days after delivery
Core question: "How likely are you to recommend [Brand] to someone looking for [product category]?"
Follow-ups:
- Promoters: "Would you be willing to share a quick video review?" (links to video testimonial collection)
- Detractors: "What could we improve about the product or your experience?"
Why it works: High-ticket promoters are your most valuable testimonial source. Routing them directly to a video testimonial request while they're feeling positive captures authentic social proof at scale.
What to do with each NPS segment
Collecting scores is step one. Acting on them is where NPS generates ROI.
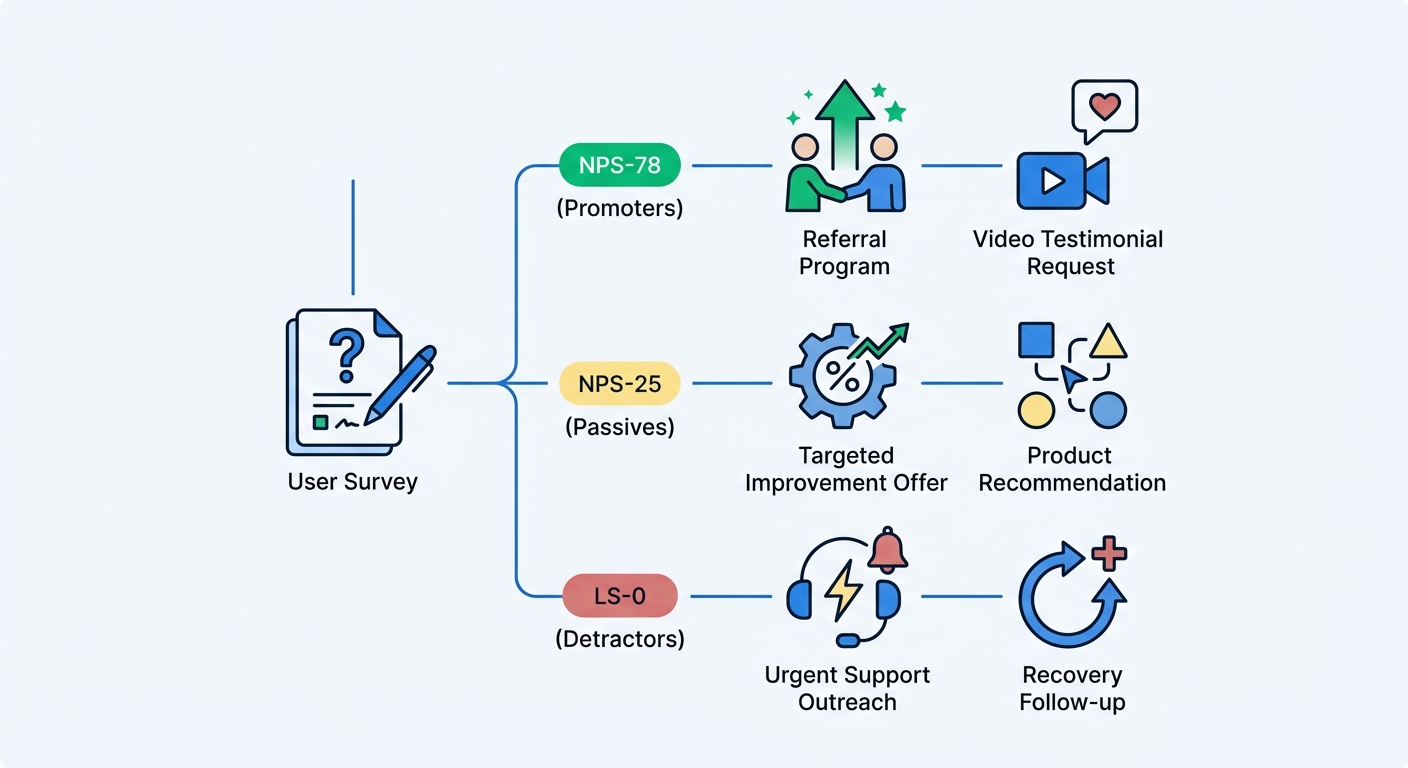
Promoters (9-10): Activate them
Promoters are your growth engine. They already love your brand. Your job is to give them ways to express that love publicly.
Referral programs: Promoters who score 9-10 are 2-4x more likely to actually refer someone than the average customer. Trigger a referral program invitation immediately after they submit their NPS score.
Testimonial requests: Ask promoters for reviews and video testimonials. Their willingness to recommend on a survey translates directly to willingness to record a 30-second video review.
Early access and loyalty perks: Give promoters first access to new products, exclusive discounts, or loyalty tier upgrades. This reinforces their positive sentiment and increases lifetime value.
Social proof mining: Read promoter follow-up responses for language you can use in marketing copy. When a customer writes "the quality is insane for this price," that's better ad copy than anything your copywriter will produce.
Passives (7-8): Convert them
Passives are satisfied but not enthusiastic. They won't actively recommend you, but they won't trash you either. Small improvements can push them into promoter territory.
Identify the gap: Read passive follow-up responses carefully. Passives often mention specific, fixable issues: "shipping was slow," "wish it came in more colors," "the packaging felt cheap." These are surgical improvement opportunities.
Targeted offers: Send passives a personalized discount or free shipping on their next order. The cost is minimal compared to the lifetime value increase of converting a passive into a promoter.
Product recommendations: Passives may not have found the right product yet. Use their purchase history to suggest products with higher satisfaction scores among similar customers.
Detractors (0-6): Recover them
Detractors are urgent. Every day a detractor goes unaddressed is a day they might post a negative review, tell friends to avoid you, or file a chargeback.
Immediate outreach: Set up alerts for detractor responses. When someone scores 0-6, trigger a notification to your support team. A personal follow-up within 24 hours can turn a detractor into a promoter. It sounds counterintuitive, but customers who have a problem resolved quickly often become more loyal than customers who never had a problem at all.
Read the follow-up: The qualitative follow-up tells you whether this is a product issue, a shipping issue, a service issue, or an expectation mismatch. Each requires a different response. Don't send a generic "sorry" email to someone who received a damaged product.
Track resolution impact: After resolving a detractor's issue, send a follow-up NPS survey 30 days later. Measure how many detractors convert to passives or promoters. This "recovery rate" is one of the most valuable metrics in customer experience.
Revenue-aware NPS: connecting scores to dollars
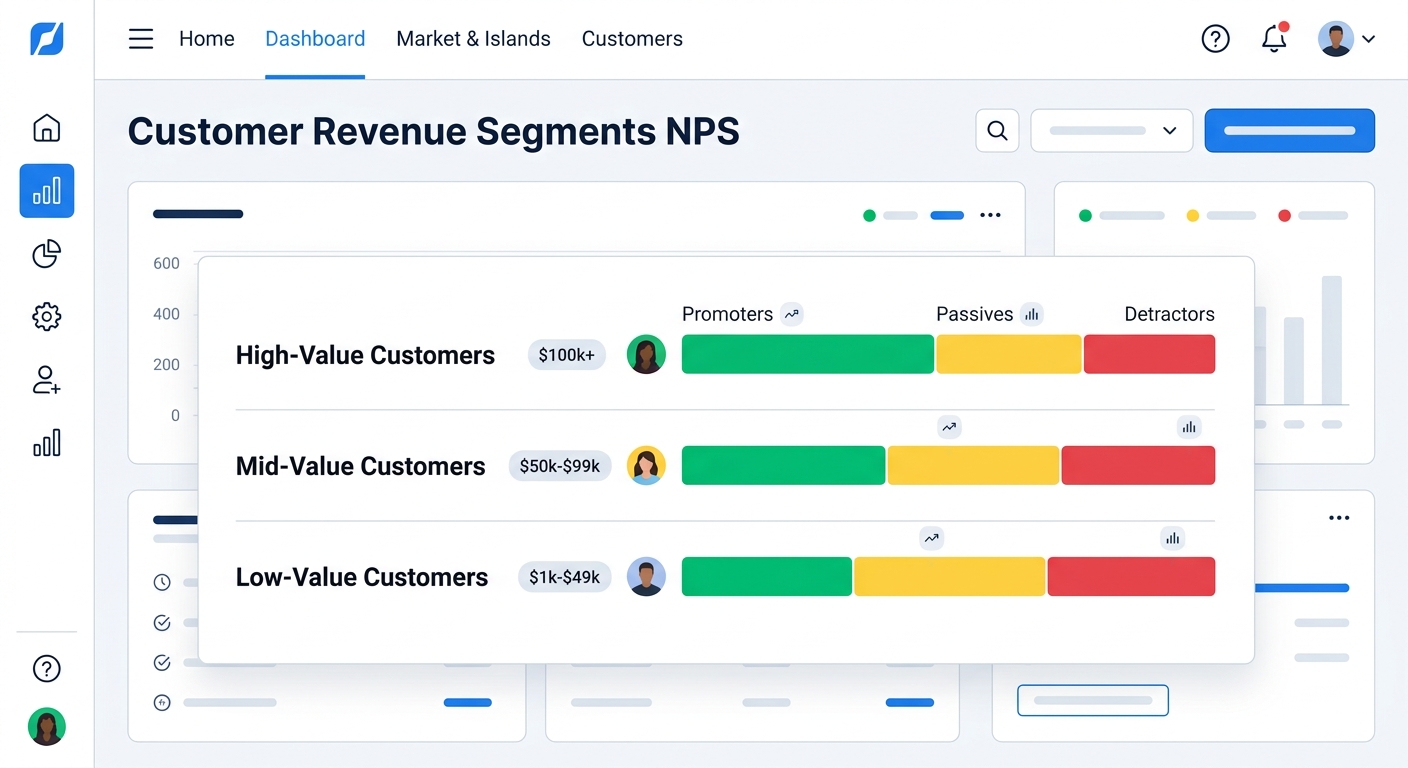
Standard NPS treats a $20 customer and a $2,000 customer identically. Revenue-aware NPS fixes this by linking every response to actual order data.
What revenue-aware analytics reveal
AOV by NPS segment: Are your highest-spending customers also your most satisfied? If promoters have 2x the AOV of detractors, your product quality is driving both satisfaction and revenue. If detractors have higher AOV than promoters, your premium customers have unmet expectations. That's a different problem requiring a different solution.
Revenue at risk: Calculate the total revenue represented by your detractor segment. If you have 200 detractors with an average lifetime value of $300, that's $60,000 in revenue at risk of churning. Suddenly, investing in detractor recovery has a clear ROI.
Product-level NPS: Break down NPS by product or product category. Which products generate promoters? Which generate detractors? This feeds directly into product development and merchandising decisions. Stop promoting products with low NPS. Double down on products your customers actively recommend.
Channel-level NPS: Cross-reference NPS data with attribution survey responses to see which acquisition channels bring in the most satisfied customers. You might discover that customers from TikTok ads have an NPS of 60 while customers from Google Shopping have an NPS of 25. That's not just a satisfaction insight; it's a customer quality signal that should inform your ad spend.
Setting up revenue-aware NPS
UserLoop automatically links NPS responses to Shopify order data. No manual CSV exports, no spreadsheet vlookups. Every NPS response shows alongside the customer's order value, product purchased, purchase frequency, and acquisition channel.
This means you can ask questions like:
- "What's the NPS of customers who purchased [Product X] vs. [Product Y]?"
- "Do repeat customers have higher NPS than first-time buyers?"
- "Which marketing channel produces customers with the highest NPS?"
For deeper analysis, UserLoop's MCP integration lets you query NPS data conversationally through Claude or ChatGPT. Ask "show me NPS trends for customers who spent over $100 in the last quarter" and get an instant answer with supporting data. No dashboards to build, no SQL to write.
NPS benchmarks for Shopify stores
Benchmarks help you calibrate whether your NPS is good, average, or concerning. But treat them as directional guidance, not gospel. Your NPS compared to your own historical trend matters more than your NPS compared to industry averages.
General ecommerce NPS benchmarks:
- Below 0: Serious problems. More detractors than promoters. Prioritize understanding why.
- 0-20: Below average. Common for commodity products or price-sensitive categories.
- 20-40: Average for ecommerce. Room for improvement but not alarming.
- 40-60: Good. Your customers are generally happy and willing to recommend.
- 60+: Excellent. Strong brand loyalty and organic growth potential.
Category-specific ranges:
- Fashion/apparel: 20-45 (fit and sizing issues drag scores down)
- Beauty/skincare: 30-55 (results-driven; customers who see results score high)
- Food/beverage: 35-60 (taste is binary; people either love it or don't)
- Home goods: 25-45 (quality and durability expectations vary widely)
- Supplements/health: 25-50 (results take time; timing of survey matters)
What affects benchmarks more than category:
- Price point: Higher-priced products have higher expectations and lower NPS. A $200 product needs to be significantly better than a $30 alternative to get the same score.
- Purchase frequency: Subscription businesses tend to have higher NPS because dissatisfied customers already canceled. Survivor bias inflates the number.
- Survey timing: NPS measured 3 days after delivery is typically 10-15 points higher than NPS measured 30 days after delivery. Make sure you're comparing like-for-like timing.
For more context on how NPS fits alongside other customer satisfaction metrics, see our upcoming comparison of CSAT vs. NPS vs. CES for Shopify stores.
Common NPS mistakes on Shopify
Obsessing over the score instead of the follow-up responses. The number is a signal. The qualitative responses are the insight. A 10-point NPS drop is concerning, but it's meaningless without understanding why it happened. AI-powered analysis of follow-up responses identifies the themes driving score changes automatically.
Measuring NPS once and never again. NPS is a trend metric. A single measurement is a snapshot. Monthly or quarterly tracking shows whether your improvements are working and catches declines before they become crises.
Sending NPS surveys before the customer has used the product. A day-1 NPS survey measures purchase excitement, not product satisfaction. Wait until the customer has actually experienced what they bought.
Not segmenting by anything. Overall NPS is a blunt instrument. Segment by product, by acquisition channel, by customer cohort, by order value. The segment-level view is where actionable insights live.
Treating all detractors the same. A score of 6 and a score of 0 represent very different levels of dissatisfaction. A 6 might have one small complaint that's easy to fix. A 0 had a catastrophically bad experience that requires immediate senior attention. Triage accordingly.
Not closing the loop with detractors. If a customer tells you they're unhappy and you do nothing, you've confirmed their negative perception. Every detractor response should trigger a follow-up workflow. Even a simple "we heard you and here's what we're doing about it" email changes the trajectory.
Integrating NPS with your broader survey strategy
NPS works best as one component of a multi-survey strategy, not as your only customer feedback mechanism.
Pair NPS with attribution surveys. Run a post-purchase attribution survey at checkout to capture where customers come from, then send an NPS survey post-delivery to measure satisfaction. Cross-referencing the two datasets shows which channels bring happy customers versus which bring bargain hunters who churn.
Use NPS to trigger video testimonial requests. Customers who score 9-10 are pre-qualified for video testimonials. Route promoters directly to a video recording flow while their positive sentiment is fresh.
Complement NPS with product-specific feedback. NPS measures overall brand sentiment. Product feedback surveys measure satisfaction with specific items. A customer might be a brand promoter (NPS 9) but have complaints about a particular product. Both data points matter.
Layer in popup surveys for non-buyers. NPS only reaches people who purchased. Popup surveys capture feedback from visitors who didn't convert, giving you the full picture of customer sentiment across the entire funnel.
Start measuring what matters
Here's the minimum viable NPS setup for any Shopify store:
- Install UserLoop on your Shopify store
- Create an NPS survey with the standard 0-10 question plus a conditional follow-up
- Set it to trigger 10 days after fulfillment
- Enable revenue-aware analytics so every response links to order data
- Set up detractor alerts so your team can respond within 24 hours
- Review NPS trends weekly for the first month, then monthly
You'll have actionable data within two weeks of launch. Not vanity metrics. Not charts for board decks. Actual signals about which customers are happy, which ones are leaving, and what the difference means in revenue.
The stores that grow sustainably aren't the ones with the highest NPS scores. They're the ones that measure, segment, and act on customer satisfaction data consistently. NPS is the starting point. What you do with it determines the outcome.
Ready to set up revenue-aware NPS on your Shopify store? Get started with UserLoop and launch your first NPS survey in under five minutes.
NPS, CSAT or CES: which survey should you use?
Net Promoter Score (NPS) asks about willingness to recommend your brand. Customer satisfaction (CSAT) asks how satisfied someone is with a specific experience, such as delivery or support. Customer effort score (CES) asks how easy it was to complete a task, such as getting help.
Choose the measure that matches the decision. Ask about loyalty after product use, satisfaction after an interaction, and effort after the task. Keep the wording and scale consistent when comparing results over time.
Start with the NPS template, CSAT template or customer effort template.


The agentic growth toolkit for Shopify
Ask your customers anything
UserLoop talks to your customers at scale with surveys and contests that feed one AI-queryable dataset. AI does the setup and the analysis.
- SurveysFind out why customers buy: checkout, email, link & QR.
- ContestsGiveaways that grow your list and social following.
Free plans on both apps · live in minutes