Chat With Your Survey Data: How AI Is Replacing Spreadsheet Analysis
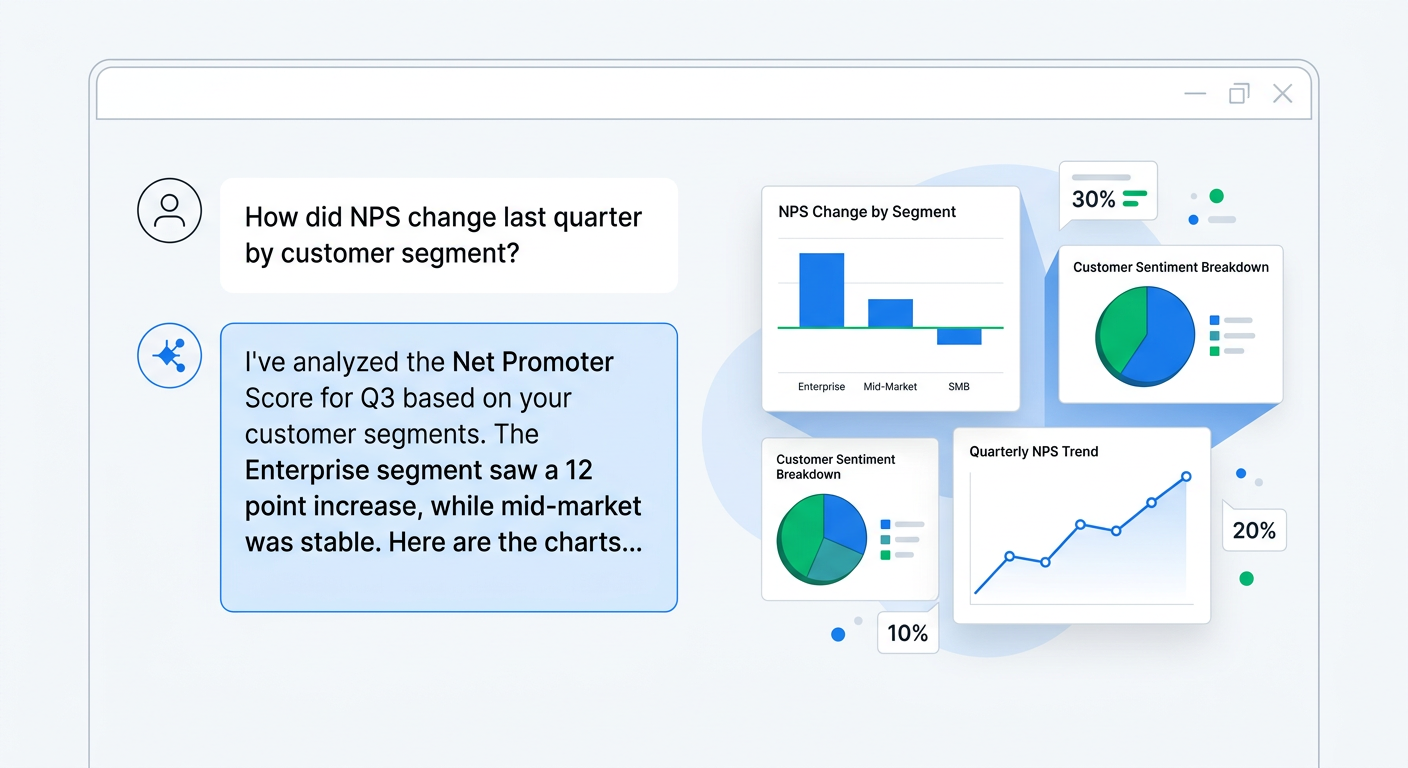
Most Shopify stores collect far more customer feedback than they ever analyze. Post-purchase surveys, exit intent popups, NPS checks, and product feedback forms generate hundreds or thousands of responses per month. The data sits there, full of insights about why people buy, why they leave, what they love, and what frustrates them.
The traditional path to making sense of it has always been the same: export a CSV, open it in Google Sheets or Excel, start tagging open-text answers, build pivot tables, create charts, and try to turn raw numbers into a story you can act on.
That process is slow, inconsistent, and fundamentally limited. AI is changing the game. Instead of moving data into a spreadsheet, you keep it where it lives and talk to it directly.
The old way: spreadsheets, tagging, and lost weekends
Exporting survey data and analyzing it manually follows a familiar painful pattern.
First you download the responses. Then you spend hours reading every open-ended comment and assigning categories: "shipping", "price", "sizing", "quality", "support". Different people tag the same response differently. You fight with inconsistent categories as volume grows.
Quantitative answers are easier but still require work. You build pivot tables to cross-tab satisfaction by channel, or average order value by NPS segment. You copy data into another sheet to join survey responses with order values so you can see which complaints come from your highest-value customers.
By the time you finish the report, the data is already stale. New responses have arrived. The patterns you found are interesting but hard to act on quickly because the analysis lives in a static document that nobody else on the team reads.
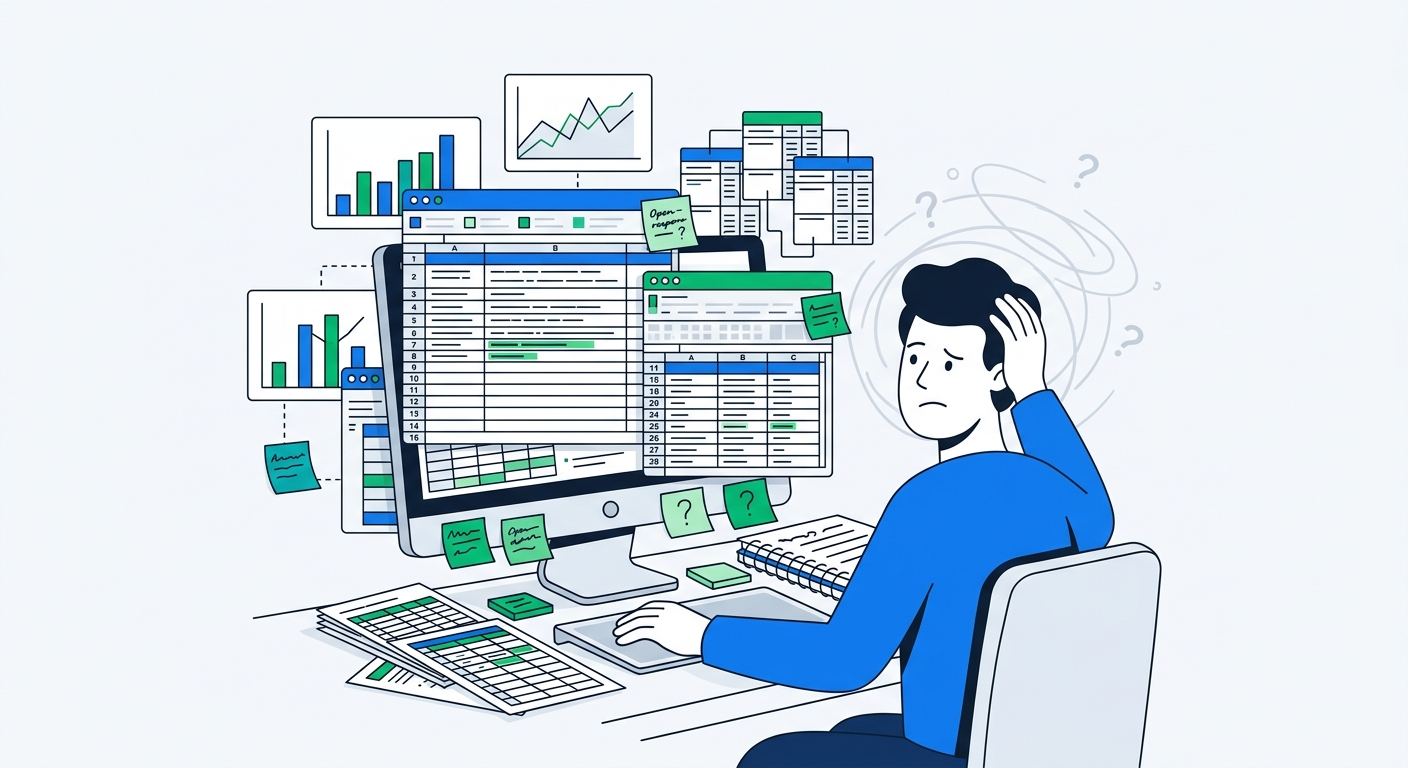
The real cost is not just time. It is the questions you never ask because they would take too long to answer. "How does satisfaction differ between first-time and repeat buyers this month?" "Which marketing channel's customers complain most about sizing?" "What themes appear in feedback from orders over $150 versus under $50?"
Those questions stay unasked. Decisions get made on gut feel or the loudest voice in the room instead of the full picture sitting in your survey responses.
What makes survey data different from other business data
Survey responses are messy in ways spreadsheets were never designed to handle well.
Open text dominates the value. The multiple choice and rating questions give you structure, but the real gold is in the "Why?" and "Anything else?" fields. That text is where customers tell you the truth in their own words.
Volume and velocity. A growing store can generate 500-2000 responses per month across multiple survey types. Manual analysis does not scale linearly.
Revenue linkage matters. A complaint from a $30 order is not the same as the same complaint from a $300 order. Most generic analysis tools treat every response equally unless you manually join datasets.
Context is everything. The same answer means different things depending on the question, the page the survey appeared on, the customer's order history, and when they responded.
Traditional BI tools and even basic AI + CSV uploads force you to flatten all of that context away or do the joining yourself.
How AI changes the fundamentals
Modern AI can do three things that transform survey analysis:
Theme extraction at scale. Instead of you defining categories in advance and tagging every response, the model reads the text and surfaces the actual themes that appear. It groups similar comments automatically and can adapt as new topics emerge.
Conversational querying. You do not write formulas or build dashboards. You ask the question the way you would ask a smart colleague who has read every response: "What are customers saying about our new packaging?" or "Which channels have the highest NPS and why?"
Native revenue awareness. When the survey platform already links every response to the order value and other attributes, the AI can answer questions that combine satisfaction, behavior, and money without extra data prep.
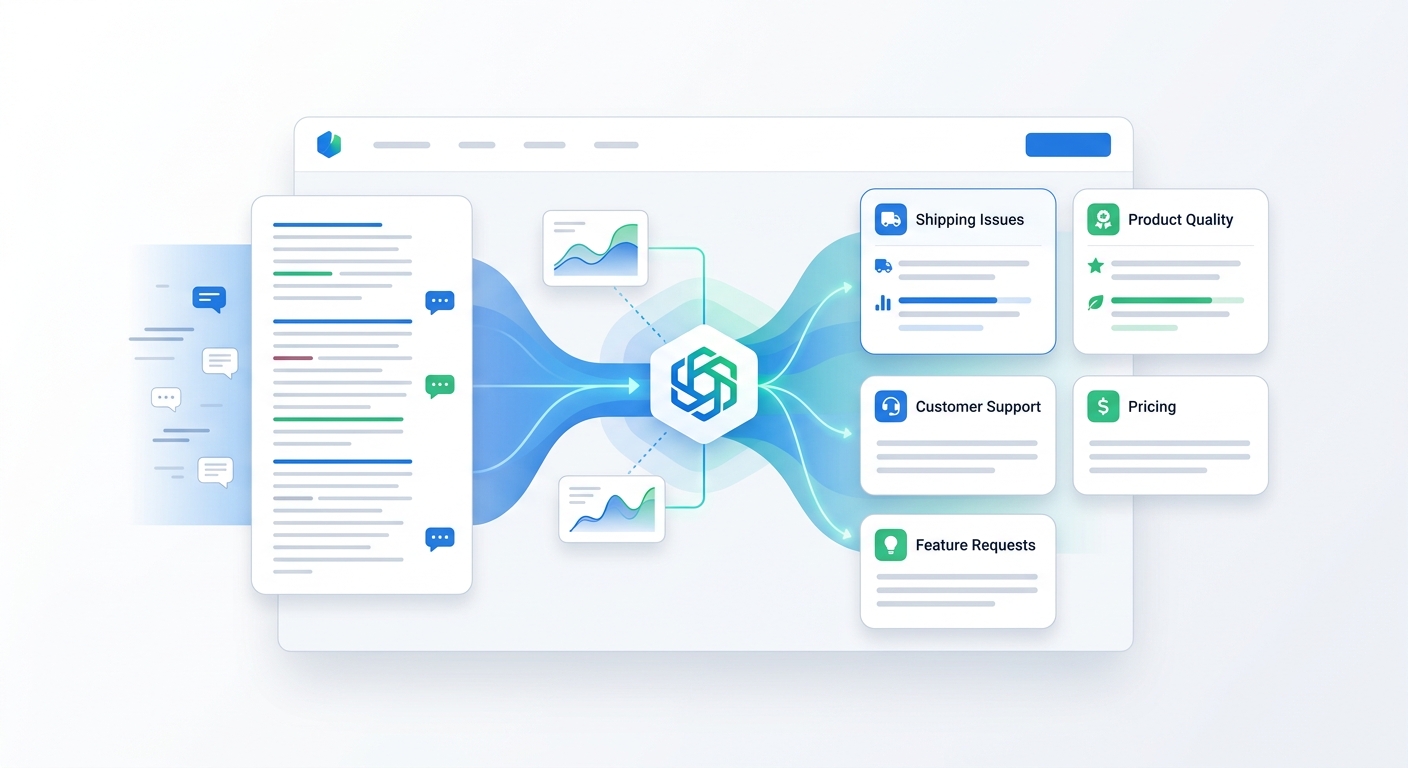
This is not theoretical. Dedicated feedback platforms have been adding AI summarization and theme detection for a few years. What is newer is the ability to go beyond pre-built dashboards and have a true back-and-forth conversation with your exact dataset.
Chat with your data via MCP
UserLoop exposes your survey data through an MCP server. MCP (Model Context Protocol) is an open standard that lets AI assistants like Claude and ChatGPT securely connect to external data sources and tools.
Once connected, the AI assistant can use purpose-built tools to query your responses instead of you exporting anything. It calls the right endpoints, receives structured data, reasons over it, and returns a clear answer. You stay inside the chat interface you already use.
The server provides seven focused tools:
- List your surveys and their structure
- Pull aggregated counts for any question
- Retrieve open-ended text responses
- Access raw responses with full customer and order context
- Fetch a single response by ID
- Health checks
Because the tools are survey-native, the AI understands the shape of the data. It does not hallucinate column names or struggle with joins. It can filter by date range, survey type, order value bands, or channel automatically when you ask.

Privacy is handled at the source. Email addresses are redacted by default before anything reaches the AI (ja**@ex*****.com). You control whether to relax that for specific use cases.
Real questions and what the answers look like
The power shows up in the kinds of questions merchants actually ask once the friction disappears.
"What are the top reasons customers almost didn't buy this month?"
The AI reads exit intent and post-purchase responses from the last 30 days, surfaces the dominant themes (price perception, shipping cost visibility, sizing uncertainty, trust signals), and gives percentages plus representative quotes. It can break it down by device or traffic source if you ask follow-ups.
"Which marketing channels drive the highest average order value, and what do those customers say about us?"
It pulls attribution survey data, joins with order values, ranks channels by AOV, and then pulls the open-text comments from the highest-value segment. You see not just the numbers but the language people use when they spend more.
"Summarize what customers are saying about shipping this quarter. Any trends?"
It pulls the relevant open responses, groups them (delays, cost, communication, packaging damage), shows volume over time, and flags whether the pattern is improving or worsening. You can then ask "What changed after we switched carriers?"
"Compare NPS between new and returning customers. What drives the difference?"
The AI looks at your NPS surveys, segments by first-time vs repeat, calculates the scores, and extracts the themes that appear more in detractors from each group.
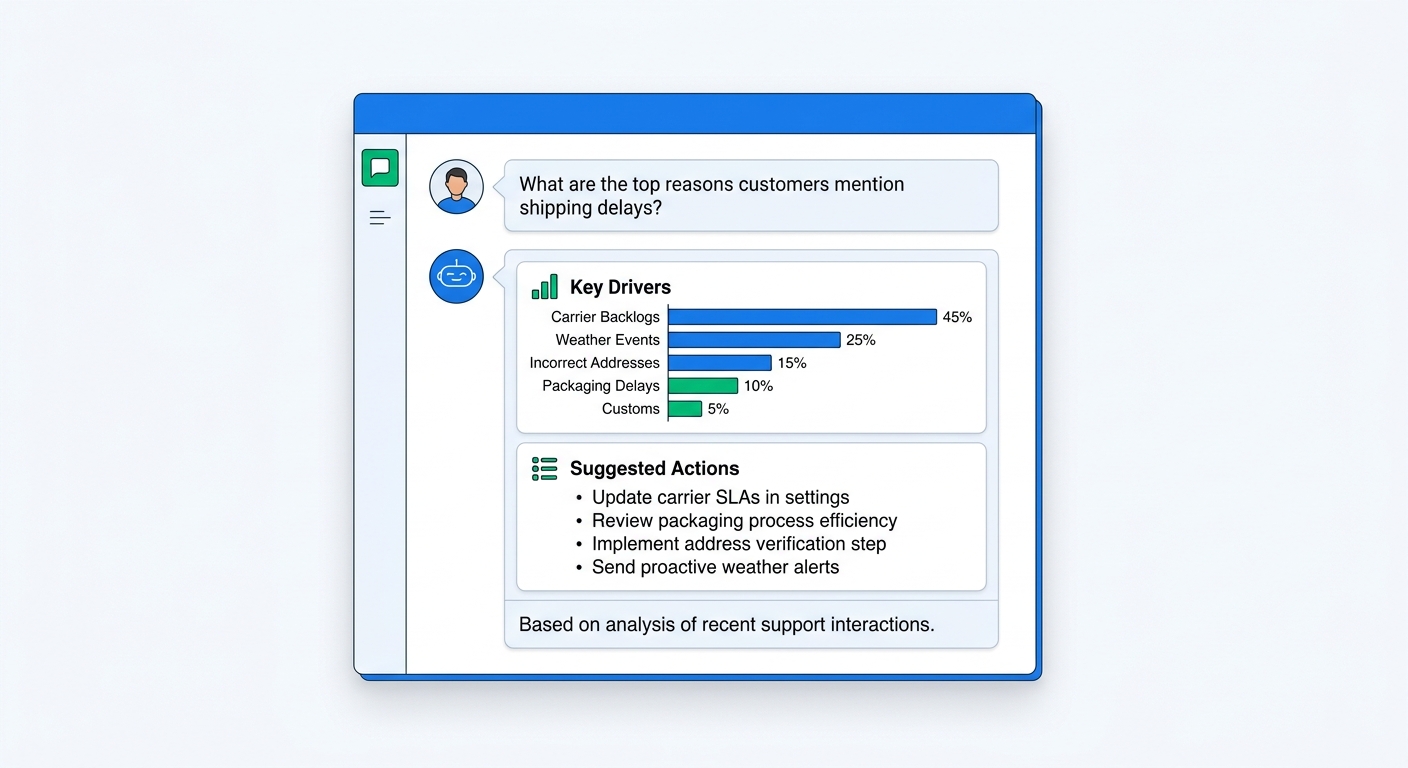
Each answer takes seconds. Follow-up questions take seconds more. What used to require exporting data, writing queries or formulas, cleaning results, and formatting a slide now happens in a running conversation you can share with your team by screenshot or by giving them the same MCP access.
Built-in AI insights vs. conversational MCP
UserLoop already runs automated theme extraction and shows summary cards inside the dashboard. Those are excellent for at-a-glance monitoring and spotting broad patterns without any setup.
MCP is the next layer. It lets you ask ad-hoc, specific, follow-up questions that no pre-built dashboard anticipated. The built-in insights tell you what the system thinks is important. The chat interface lets you pursue the questions that matter to your business right now.
Most merchants use both: the dashboard for ongoing visibility, and the chat connection for deep dives and one-off analysis before important decisions.
Setup takes minutes
Connecting your data requires no code and no export pipeline.
For Claude Desktop:
Open Settings > Developer > Edit Config and add the MCP server entry pointing to https://mcp.userloop.io/mcp?api_key=YOUR_API_KEY. Restart the app.
For ChatGPT:
In Settings > Apps & Connectors, create a new custom GPT connector, point it at the MCP URL, and add the API key as a custom header.
The first time you connect, ask a simple verification question like "List my recent surveys" or "How many responses did we get last week?" If it returns real data, you are live.
Full setup details and the exact config snippets live in the feature announcement post.
The business impact
The shift from spreadsheet analysis to conversational access changes how teams use feedback.
Speed to insight. Questions that used to take an afternoon now take under a minute. That means you actually answer them instead of adding them to a backlog.
Broader access. You do not need to be the person who knows the spreadsheet or the BI tool. The marketing lead, the product manager, or the founder can all ask their own questions directly.
Better questions. When exploration is cheap, you explore more. You find the second-order patterns (the intersection of channel, order value, and specific complaint) that drive real decisions.
Tighter feedback loops. You can test a change on the site, run a survey, and within days ask the AI whether the new experience moved the needle on the exact issue you were trying to fix.
Revenue focus. Because responses carry order context, every analysis naturally surfaces which problems and delights are coming from the customers who spend the most.
Stores using conversational analysis report moving from monthly "feedback review" meetings to daily or weekly micro-adjustments based on fresh signals.
Limitations and how to think about them
AI analysis is not magic and does not replace human judgment. It can misclassify edge cases, over-generalize, or miss sarcasm. It is excellent at synthesis and pattern spotting across volume, weaker at deep strategic interpretation.
The best results come from treating the AI as a very fast, very well-read research assistant. You still decide what questions are worth asking, what the answers mean for your roadmap or campaigns, and which patterns deserve a human follow-up (reading the actual raw responses or reaching out to customers).
Start with verification questions ("Show me the last 5 responses that mentioned X") until you trust the connection, then move to higher-level synthesis.
Getting started with conversational survey analysis
If you are already running surveys on Shopify, the fastest path is to connect the MCP server to Claude or ChatGPT and try three real questions from your last 30 days of data today.
If you are not yet collecting the right feedback, the highest-leverage starting points are:
- A simple post-purchase attribution survey ("How did you hear about us?") to understand channel performance.
- An exit intent or popup survey on product and collection pages to learn why visitors leave.
- An NPS or satisfaction question sent after delivery.
You can add a video question to any of them to collect testimonials at the same time.
Install UserLoop from the Shopify App Store to get the full stack: multiple survey types, discount automation on survey completion, built-in AI insights, and the MCP server for conversational access. The Pro plan includes popup surveys and MCP.
The data is already there. The difference is whether you can actually talk to it.
Related reading
- New in UserLoop: Popup Surveys, App Blocks, and AI Analysis via MCP — the original announcement with setup details.
- How to Collect Video Testimonials from Customers (Without an Agency) — turn the same post-purchase moment into UGC.
- Exit Intent Popup Surveys for Shopify — capture feedback from the visitors who almost bought.
If you want to see what your customers are actually saying, stop exporting spreadsheets and start asking.


The agentic growth toolkit for Shopify
Ask your customers anything
UserLoop talks to your customers at scale with surveys and contests that feed one AI-queryable dataset. AI does the setup and the analysis.
- SurveysFind out why customers buy: checkout, email, link & QR.
- ContestsGiveaways that grow your list and social following.
Free plans on both apps · live in minutes