"How Did You Hear About Us?" Survey: Setup Guide & AI Analysis
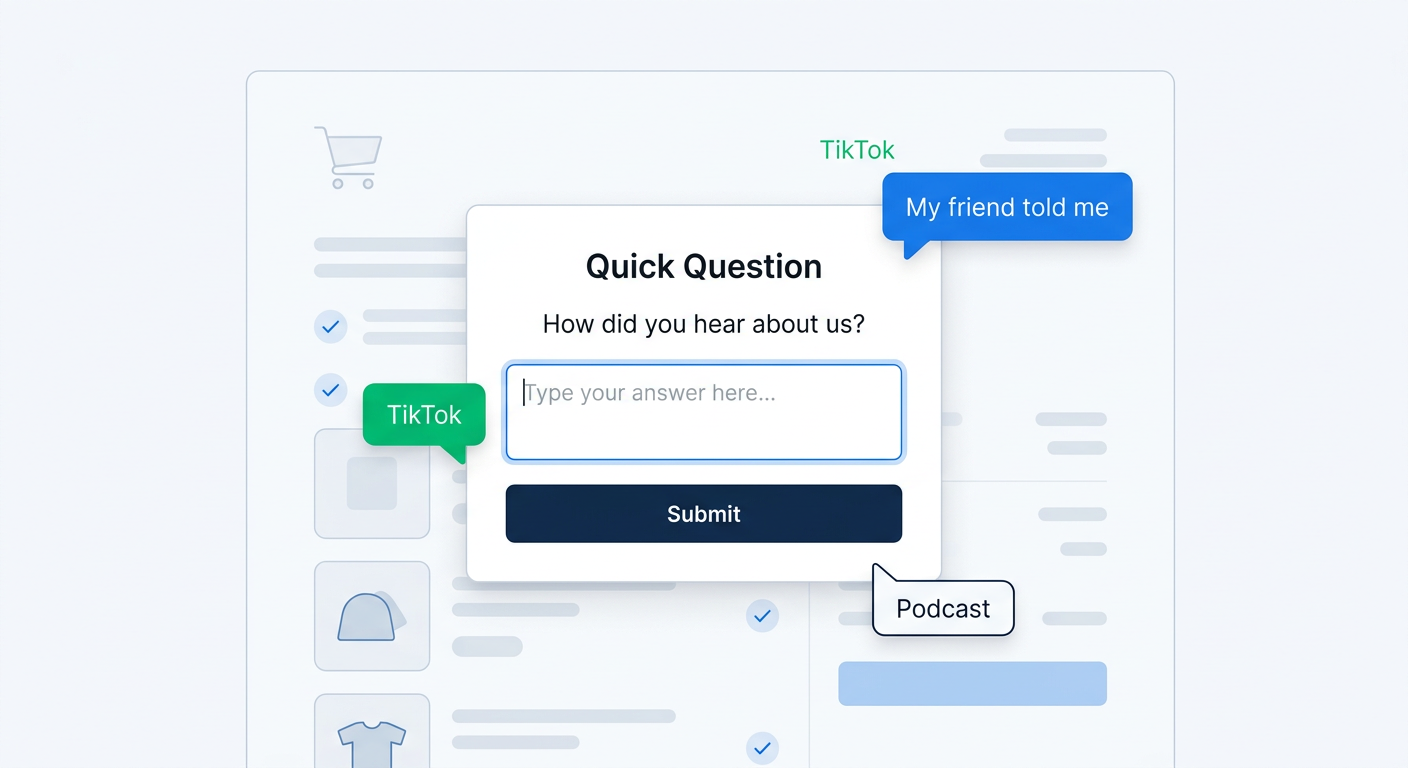
Every Shopify store has the same problem: you don't actually know where your customers come from.
Google Analytics tells you about clicks. Meta Ads Manager tells you about impressions. Neither one tells you about the podcast your customer listened to on their commute, the friend who texted them a link, or the Reddit thread where someone mentioned your product six months ago.
The "How did you hear about us?" survey captures what analytics can't. It takes two seconds for the customer to answer, costs nothing to run, and reveals attribution channels that are invisible to every tracking pixel on the internet.
This guide covers everything: where to place the question, why open-text responses beat multiple choice, how to get high response rates, and how AI channel grouping turns hundreds of messy freeform answers into clean, actionable attribution data.
Why this one question matters more than your entire analytics stack
Bold claim. Here's why it holds up.
Traditional digital attribution tracks clicks. A customer clicks a Meta ad, lands on your site, and buys. Google Analytics records "Paid Social" as the source. Clean, simple, and often wrong.
That customer might have seen your product on TikTok three weeks ago, heard about it from a coworker, Googled your brand name, clicked a retargeting ad, and then purchased. Every tool in your stack credits the last click. The ad gets credit. The coworker, the TikTok video, and the Google search get nothing.
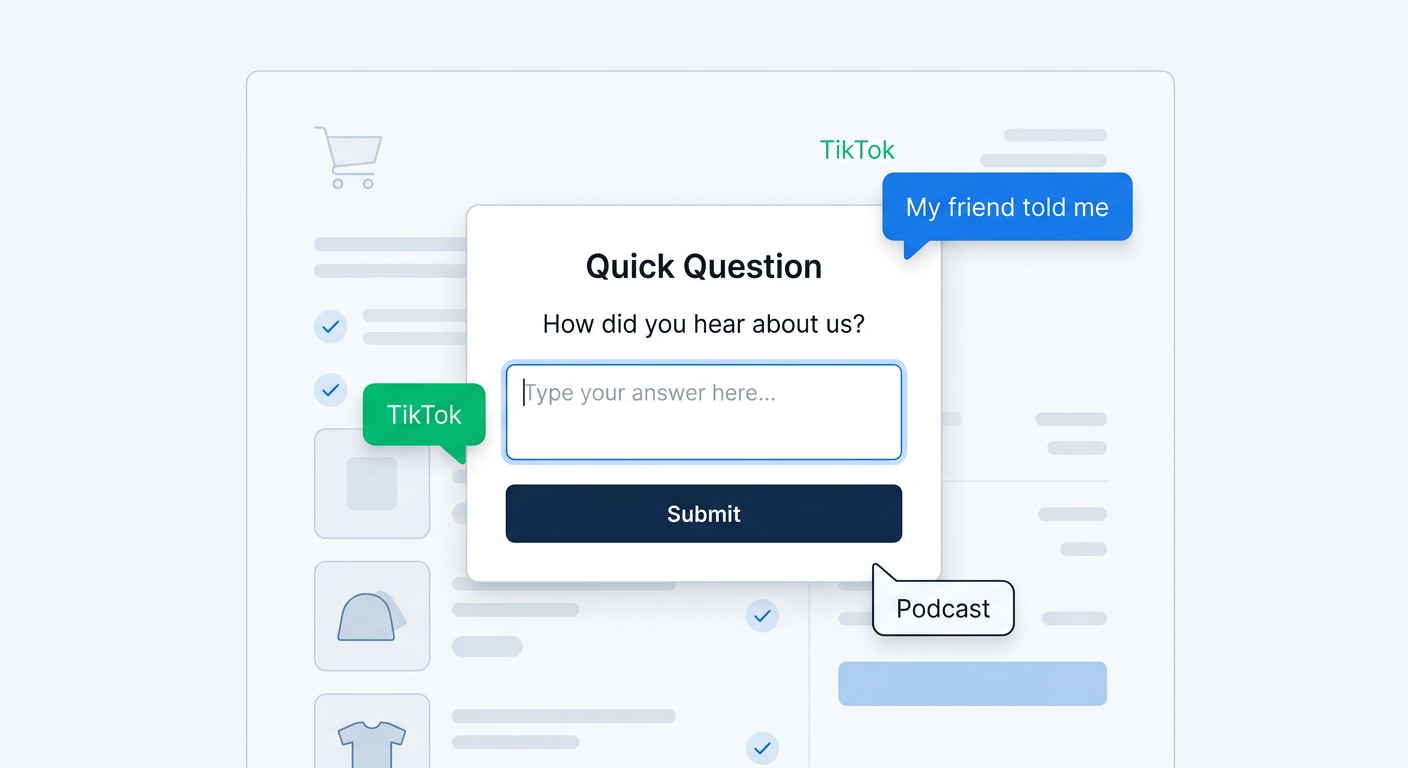
Post-purchase attribution surveys fix this by asking the customer directly. People know how they found you. They remember the friend who told them, the Instagram reel they saved, the podcast ad they heard. They just need a place to tell you.
The data is consistently surprising. Stores that add a "How did you hear about us?" question typically discover that 20-40% of their customers come from channels that don't show up in analytics at all. Word of mouth, podcast mentions, in-person recommendations, PR coverage, community posts. These are often your highest-converting channels, and you'd never know they existed without asking.
Open-text vs. multiple choice: this matters more than you think
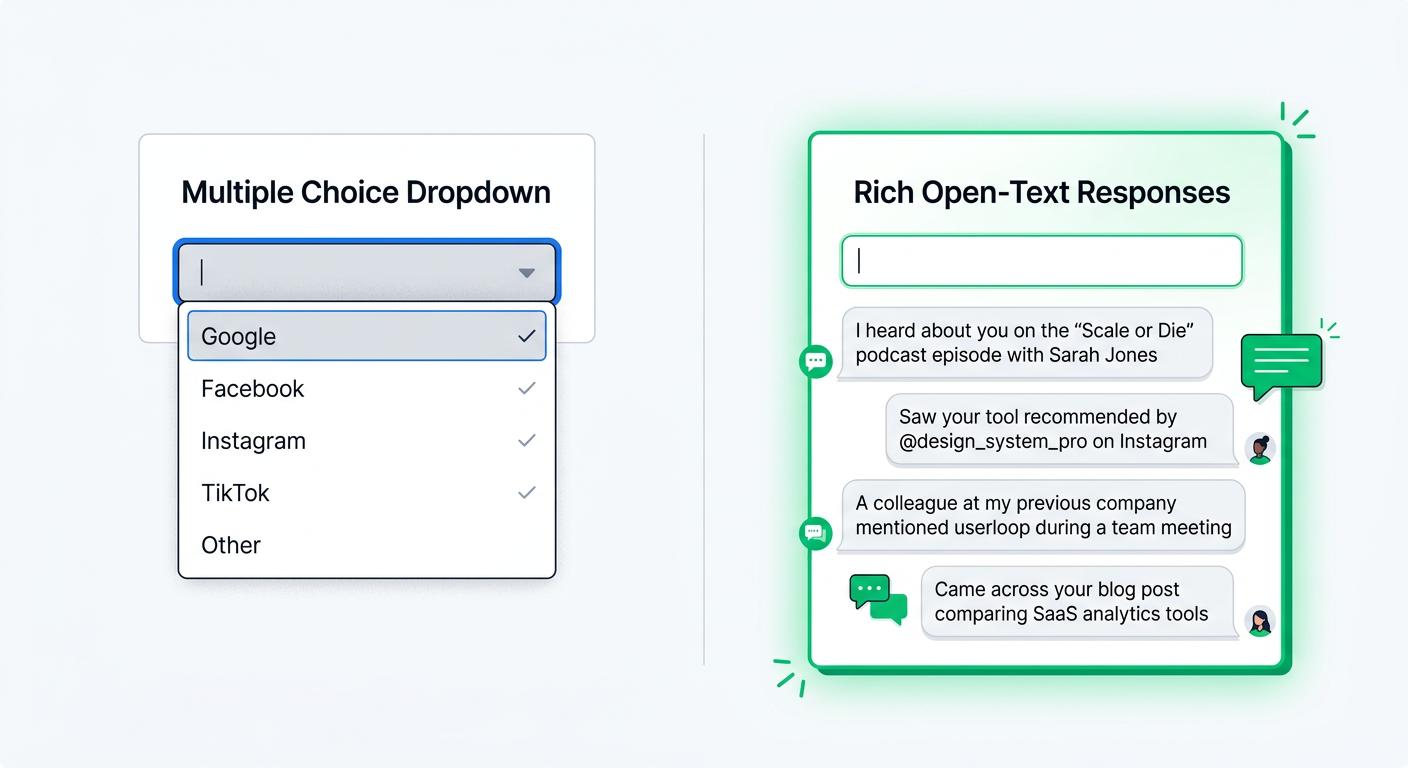
Most stores that ask "How did you hear about us?" use a dropdown with five or six options: Google, Facebook, Instagram, Friend/Family, Other. This feels organized. It's actually a trap.
Multiple choice forces customers into categories you've already defined. If a customer found you through a TikTok creator's review, they have to pick "Social Media" or "Other." If they heard about you on a podcast, they pick "Other." If their physical therapist recommended your product, they pick "Friend/Family" even though that's a professional referral, not a personal one.
You end up with data that confirms your assumptions instead of revealing the truth. Your "Other" bucket grows to 25% of responses and contains all the interesting signals you actually needed.
Open-text responses capture the full picture. When customers type their answer, you get specifics:
- "My friend Sarah told me about you"
- "Saw a TikTok from @hannahreviews"
- "Heard the ad on Crime Junkie podcast"
- "My dermatologist recommended it"
- "Found you on a Reddit thread about meal prep containers"
- "Saw your booth at the farmers market last weekend"
Each of these is a different channel with different implications for your marketing strategy. A dropdown would collapse them all into "Social Media," "Friend/Family," or "Other."
The objection to open-text is always the same: "How do I analyze hundreds of unique responses?" That used to be a real problem. It's not anymore. AI solves it completely, and we'll get to that.
Where to place the survey for maximum response rates
Placement determines whether 5% or 60% of your customers answer the question. The order status page (also called the thank-you page or order confirmation page) is the best location by a wide margin.
The order status page: your highest-leverage spot
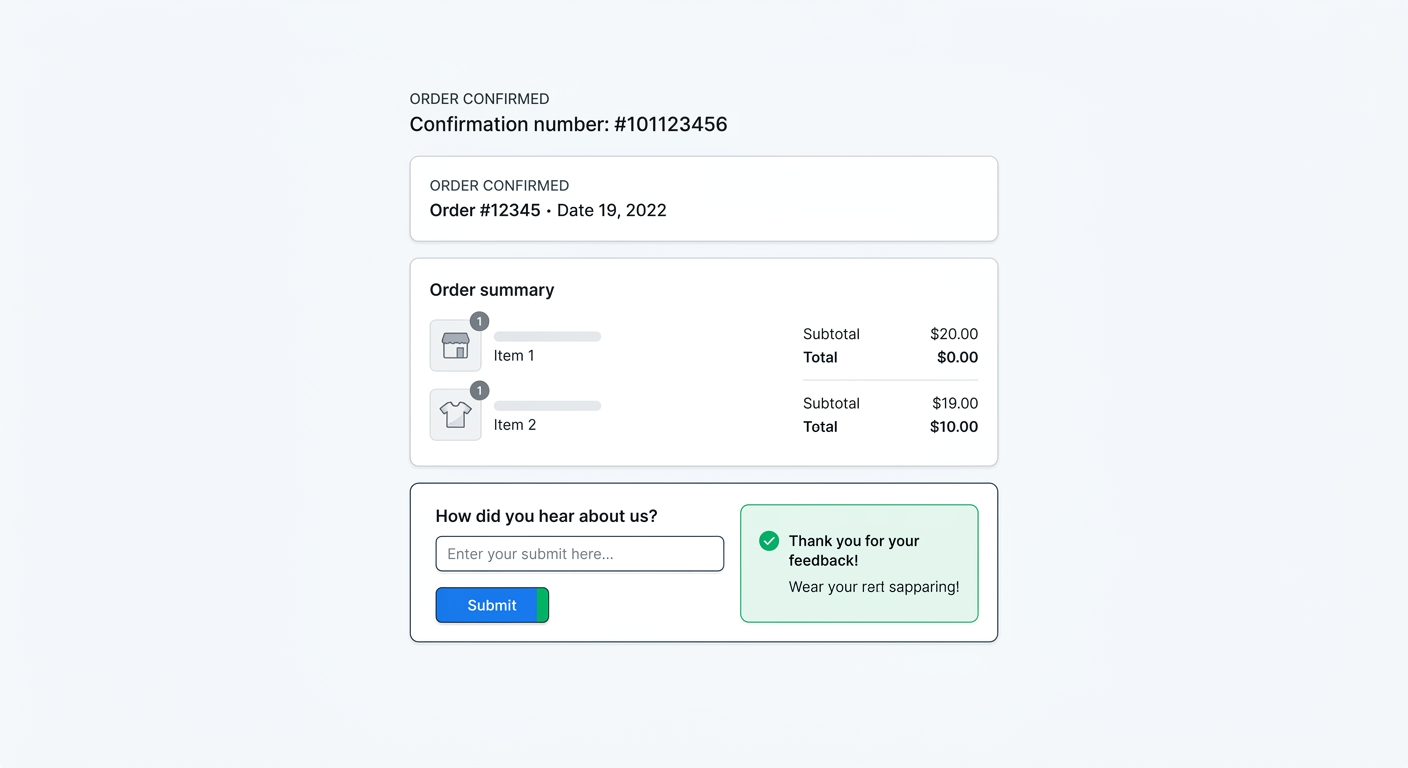
Right after checkout, the customer is on your site, engaged, and in a cooperative mood. They just bought something. They're waiting for the confirmation to load. A single question at this moment gets response rates between 40-60%.
On Shopify, you can add a survey directly to the order status page using a checkout extension or an app block. The question appears inline with the order confirmation, not as a popup or a separate page. It feels like part of the checkout experience.
The key to high response rates here is simplicity. One question. One text field. No "Next" button leading to a second page of questions. The customer types their answer, hits submit, and goes on with their day.
Post-purchase email: the follow-up option
If you want to ask additional questions beyond the checkout survey, a post-purchase email survey sent 1-3 days after purchase is the second-best option. Response rates are lower (10-20%), but you can ask 2-3 questions without feeling intrusive.
For attribution specifically, the checkout page is better because the customer's memory of how they found you is freshest right after purchase. Two days later, the specifics start to fade.
Popup surveys: for pre-purchase attribution
Popup surveys can also ask "How did you hear about us?" before the customer buys. This captures attribution data from visitors who don't convert, which is useful for understanding your full funnel. But for confirmed customer attribution, the post-purchase placement wins.
Setting up a "How did you hear about us?" survey on Shopify
Here's the practical setup, step by step.
Step 1: Install a survey app that supports open-text checkout surveys
You need an app that can place a survey on the Shopify order status page and collect open-text responses. Not all survey apps support this. Some only do email surveys. Some only support multiple choice.
UserLoop supports open-text checkout surveys out of the box. The survey appears as an embedded block on the order status page, and responses are collected automatically with every order.
Step 2: Configure the question
Keep it simple. The question is "How did you hear about us?" with an open-text field. No need for fancy branching logic or conditional follow-ups on the first question. You want the lowest possible friction between seeing the question and submitting an answer.
Some stores add a brief follow-up: "Can you tell us more?" This is triggered after the first response and captures additional detail. A customer who types "Instagram" in the first field might add "I saw a reel from a creator I follow" in the follow-up. That extra context is gold for your marketing team.
Step 3: Start collecting responses
Turn it on and let it run. You'll want at least 100 responses before drawing conclusions, which most stores hit within 1-2 weeks. The first batch of responses will already contain surprises. Channels you've never targeted. Specific creators or publications driving traffic. Offline sources that no pixel can track.
Step 4: Review your first results
After a week or two of data, look at the raw responses. You'll notice two things immediately:
- Channels you didn't expect. Every store discovers at least one significant channel they weren't tracking.
- The mess. "TikTok," "tiktok," "tik tok," "I saw a TT video," "a video on tiktok," and "my for you page" all mean the same thing but look like six different responses.
This mess is exactly why you need AI analysis instead of a spreadsheet.
How AI channel grouping transforms raw responses into clean attribution data
This is where the real value unlock happens. You've collected hundreds of open-text responses. Now what?
Manual analysis means reading every response, deciding which channel it belongs to, and tagging it. At 50 responses per week, this is tedious. At 500 responses per week, it's impossible. At any volume, it's inconsistent because different people will categorize the same response differently.
UserLoop's AI channel grouping reads every response and automatically assigns it to the correct attribution channel. No rules to configure. No regex patterns to maintain. No manual tagging. The AI understands natural language, so it knows that "my coworker told me," "word of mouth," "a friend recommended you," and "my wife bought from you before" all belong in the same bucket.
What AI channel grouping actually does
The AI processes each response through several layers:
Language normalization. "Tiktok," "tik tok," "TT," and "my fyp" all get recognized as TikTok. The AI handles typos, abbreviations, slang, and variations without any configuration.
Intent recognition. "I Googled best face moisturizer" is organic search. "I clicked an ad on Google" is paid search. Both mention Google, but they're fundamentally different channels. The AI distinguishes between them based on context.
Channel categorization. Every response gets assigned to a clean channel bucket: Paid Social, Organic Social, Paid Search, Organic Search, Word of Mouth, Podcast, Influencer/Creator, Email, PR/Press, In-Store/Offline, Direct/Brand Search, and others.
Specificity preservation. Within each channel, the AI preserves specific details. Under "Podcast," you'll see which podcasts were mentioned and how many times. Under "Influencer/Creator," you'll see specific creator names. This detail is crucial for deciding where to invest.
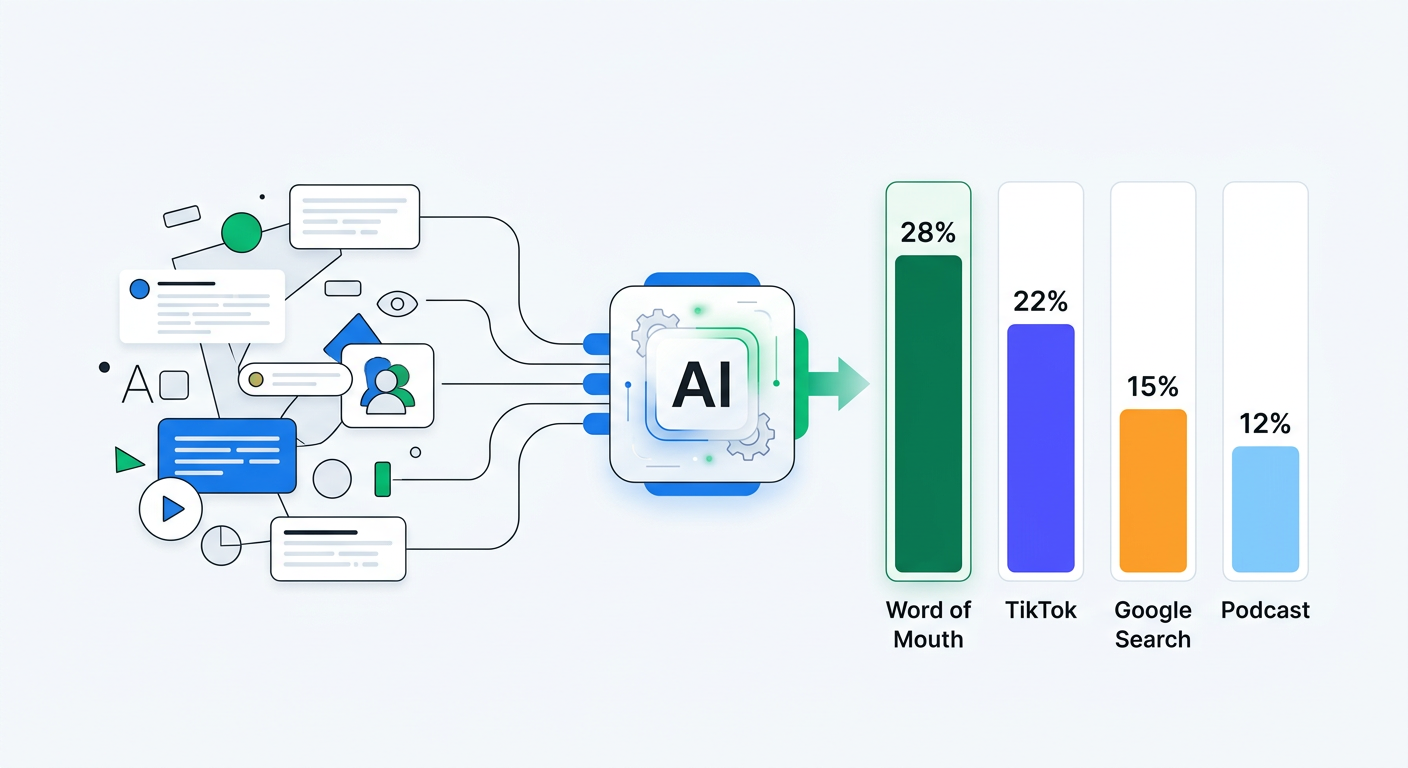
Before and after: what the data looks like
Before AI grouping (raw responses):
- "tiktok"
- "My friend told me"
- "I think I saw an ad on Instagram"
- "Google search for protein bars"
- "heard the ad on huberman lab"
- "saw it at my gym"
- "my physical therapist"
- "facebook ad"
- "word of mouth"
- "tik tok video about recovery supplements"
- "a coworker"
- "just googled you"
After AI grouping:
- Word of Mouth / Referral: 28% (friend, coworker, physical therapist)
- TikTok: 22% (organic video content)
- Paid Social: 18% (Meta ads on Instagram and Facebook)
- Google Search: 15% (organic and paid combined, with breakdown)
- Podcast: 10% (Huberman Lab and others)
- Offline / In-Person: 7% (gym, events)
That's the difference between a wall of text and a marketing strategy.
Going deeper with conversational analysis
Once your responses are grouped, you can connect your data to Claude or ChatGPT via MCP (Model Context Protocol) for deeper analysis. Instead of just looking at channel percentages, you can ask questions like:
- "Which attribution channel drives the highest average order value?"
- "Are customers who found us through word of mouth more likely to be repeat buyers?"
- "What specific TikTok creators are driving the most revenue?"
- "Has our podcast attribution increased since we started advertising on Crime Junkie?"
This kind of analysis, combining qualitative survey data with quantitative order data, is nearly impossible in a spreadsheet but takes seconds with conversational AI analysis.
What to do with your attribution data
Collecting the data is step one. Acting on it is where the revenue impact happens.
Reallocate ad spend based on actual customer sources
If your attribution survey reveals that 25% of customers come from TikTok but you're spending 5% of your ad budget there, that's a signal. If word of mouth is your top channel but you don't have a referral program, that's money left on the table.
The goal isn't to match spend to survey percentages. It's to identify mismatches between where customers come from and where you're investing. A channel that drives 15% of customers but gets 0% of your marketing budget deserves attention.
Double down on channels analytics can't see
The most actionable insight from attribution surveys is usually the discovery of "dark" channels, sources that drive real customers but don't show up in any analytics platform. Common examples:
- Podcasts. Listeners don't click links. They Google your brand name later. Analytics credits Google. Your survey credits the podcast.
- Word of mouth. The most trusted channel in existence, completely invisible to tracking pixels.
- Offline exposure. Events, physical retail, gym presence, professional recommendations.
- Community mentions. Reddit, Discord, Facebook Groups, niche forums.
When you discover a significant dark channel, invest in it. If word of mouth drives 30% of your customers, a formal referral program could be your highest-ROI marketing initiative.
Track attribution trends over time
A single snapshot of attribution data is useful. A trend over months is transformational. Track how your channel mix shifts as you change your marketing strategy.
Launched a podcast ad campaign? Watch podcast attribution in your survey data over the following weeks. Invested in a creator partnership? See if TikTok or YouTube attribution increases. Cut spend on a channel? Monitor whether customers stop mentioning it.
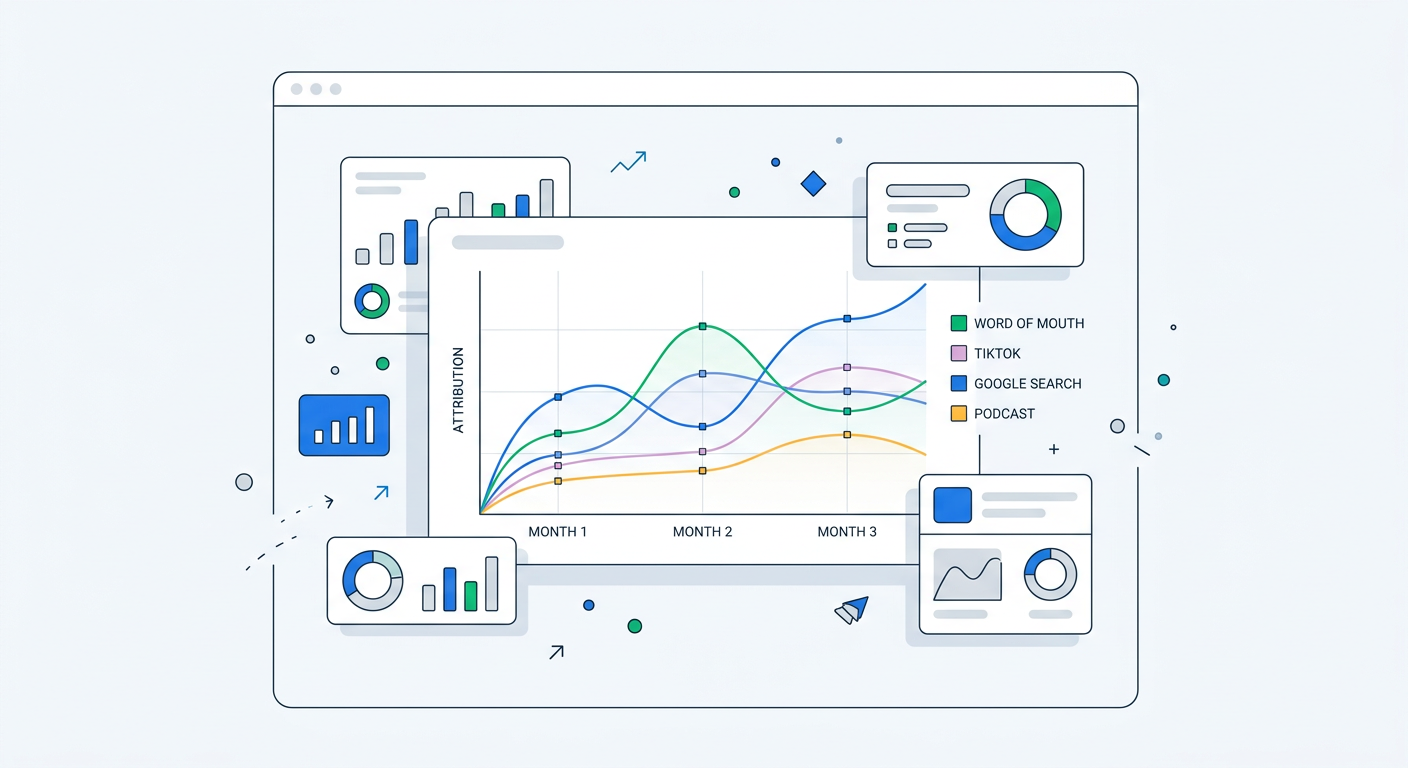
Survey-based attribution gives you a feedback loop that's impossible to get from click tracking alone.
Connect attribution to customer lifetime value
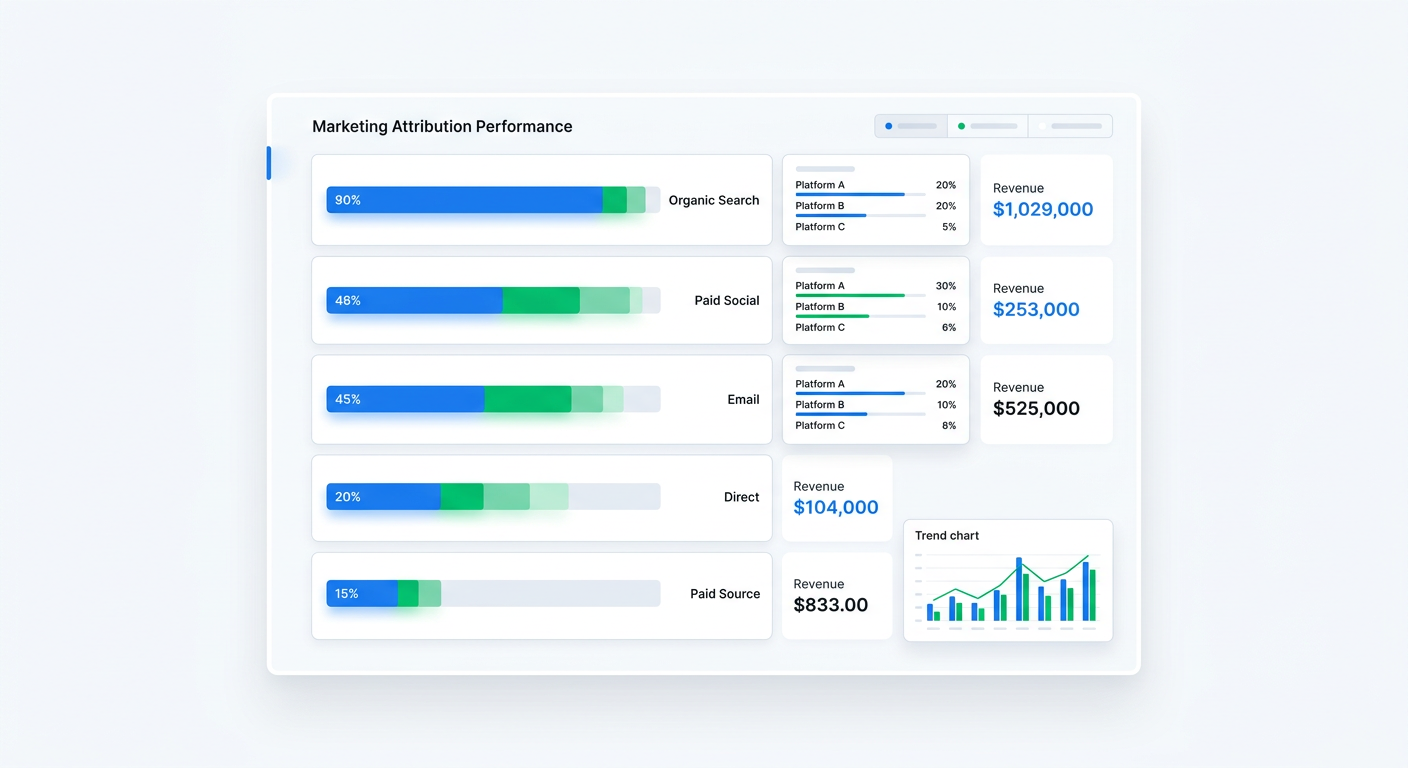
The most sophisticated use of attribution data links channels to long-term customer value, not just initial conversion. UserLoop's revenue-aware analytics connect every survey response to the associated Shopify order, so you can see average order value by attribution channel.
This often reveals that your highest-volume channel isn't your most valuable one. Paid social might drive the most customers, but word-of-mouth referrals might have 2x the AOV and 3x the repeat purchase rate. That changes how you think about where to invest.
Common mistakes to avoid
Mistake 1: Using multiple choice instead of open-text
We covered this above, but it's worth repeating because it's the most common mistake. Multiple choice feels organized. It produces cleaner-looking data. It also misses the most important signals. Use open-text. Let AI handle the organization.
Mistake 2: Asking too many questions at checkout
The order status page is prime real estate. Don't waste it with a five-question survey that tanks your response rate. One question gets 50%+ response rates. Two questions get 35-40%. Five questions get 15% and frustrated customers.
Start with "How did you hear about us?" as your single checkout question. If you want to ask more, use a follow-up email survey a few days later.
Mistake 3: Not acting on the data
Collecting attribution data and never looking at it is worse than not collecting it at all, because it creates the illusion that you know where your customers come from. Set a monthly cadence to review your attribution breakdown, compare it to your marketing spend, and make at least one adjustment.
Mistake 4: Treating all responses equally
A customer who spends $200 and says "podcast" is worth more to your attribution picture than a customer who spends $20 and says the same thing. Revenue-weighted attribution gives you a more accurate picture of which channels drive real business value, not just volume.
Mistake 5: Only running the survey for a limited time
Attribution isn't a one-time research project. It's an ongoing measurement system. Customer discovery channels shift as your marketing changes, as platforms evolve, and as word of mouth grows. Run the survey continuously.
Getting started in five minutes
Here's the fastest path from zero to collecting attribution data:
- Install UserLoop on your Shopify store
- Add a checkout survey with "How did you hear about us?" as an open-text question
- Wait for 100+ responses (usually 1-2 weeks)
- Check your AI attribution dashboard for automatically grouped channel data
- Compare your channel mix to your current marketing spend
- Make one adjustment based on what you learn
That's it. One question, five minutes of setup, and you'll know more about where your customers actually come from than your entire analytics stack can tell you.
The AI channel grouping handles the messy analysis. You just need to ask the question and act on the answers.
One question, real answers
The "How did you hear about us?" survey is deceptively simple. One question. One text field. But the data it produces fills the biggest blind spot in your marketing measurement.
Every customer who answers is telling you something your analytics can't. Where they actually discovered you. What actually drove the purchase. Which channels deserve more investment and which ones are getting credit they don't deserve.
Set it up today. Ask the question. Let AI sort the answers. Then use what you learn to spend smarter.
Install UserLoop and start collecting attribution data with built-in AI channel grouping. Your first survey takes five minutes to set up.


The agentic growth toolkit for Shopify
Ask your customers anything
UserLoop talks to your customers at scale with surveys and contests that feed one AI-queryable dataset. AI does the setup and the analysis.
- SurveysFind out why customers buy: checkout, email, link & QR.
- ContestsGiveaways that grow your list and social following.
Free plans on both apps · live in minutes