#FeedbackWeek Day 2: Introducing 'Benchmarks' to Optimize Your Survey Response Rates
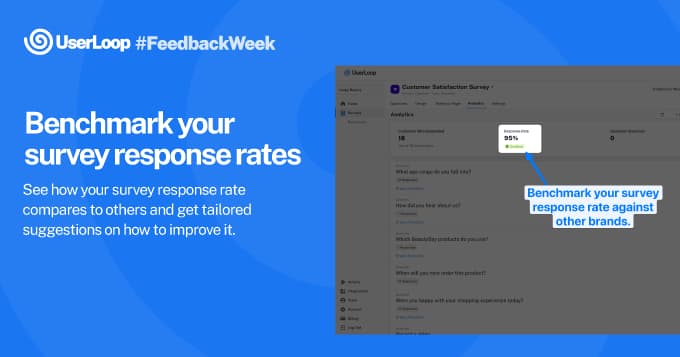
Welcome to Day 2 of our first ever #FeedbackWeek where we're launching powerful new features in UserLoop every day. We're really focussed on helping you understand your customers better, and a big part of that is making sure they're actually answering the questions you ask.
It's not always easy to know how your survey is doing in terms of responses, how do you stack up against your competitors? Is there anything you could be doing to improve your response rates and hear from more customers?
We've launched a new feature in UserLoop called Benchmarks, which shows how your survey is performing compared with other brands on the UserLoop system.
Meet 'Benchmarks'
Your survey response rate is a vital metric when it comes to understanding customer engagement. However, understanding how your response rate stacks up against industry standards can be challenging. That's where our new 'Benchmarks' feature comes in.
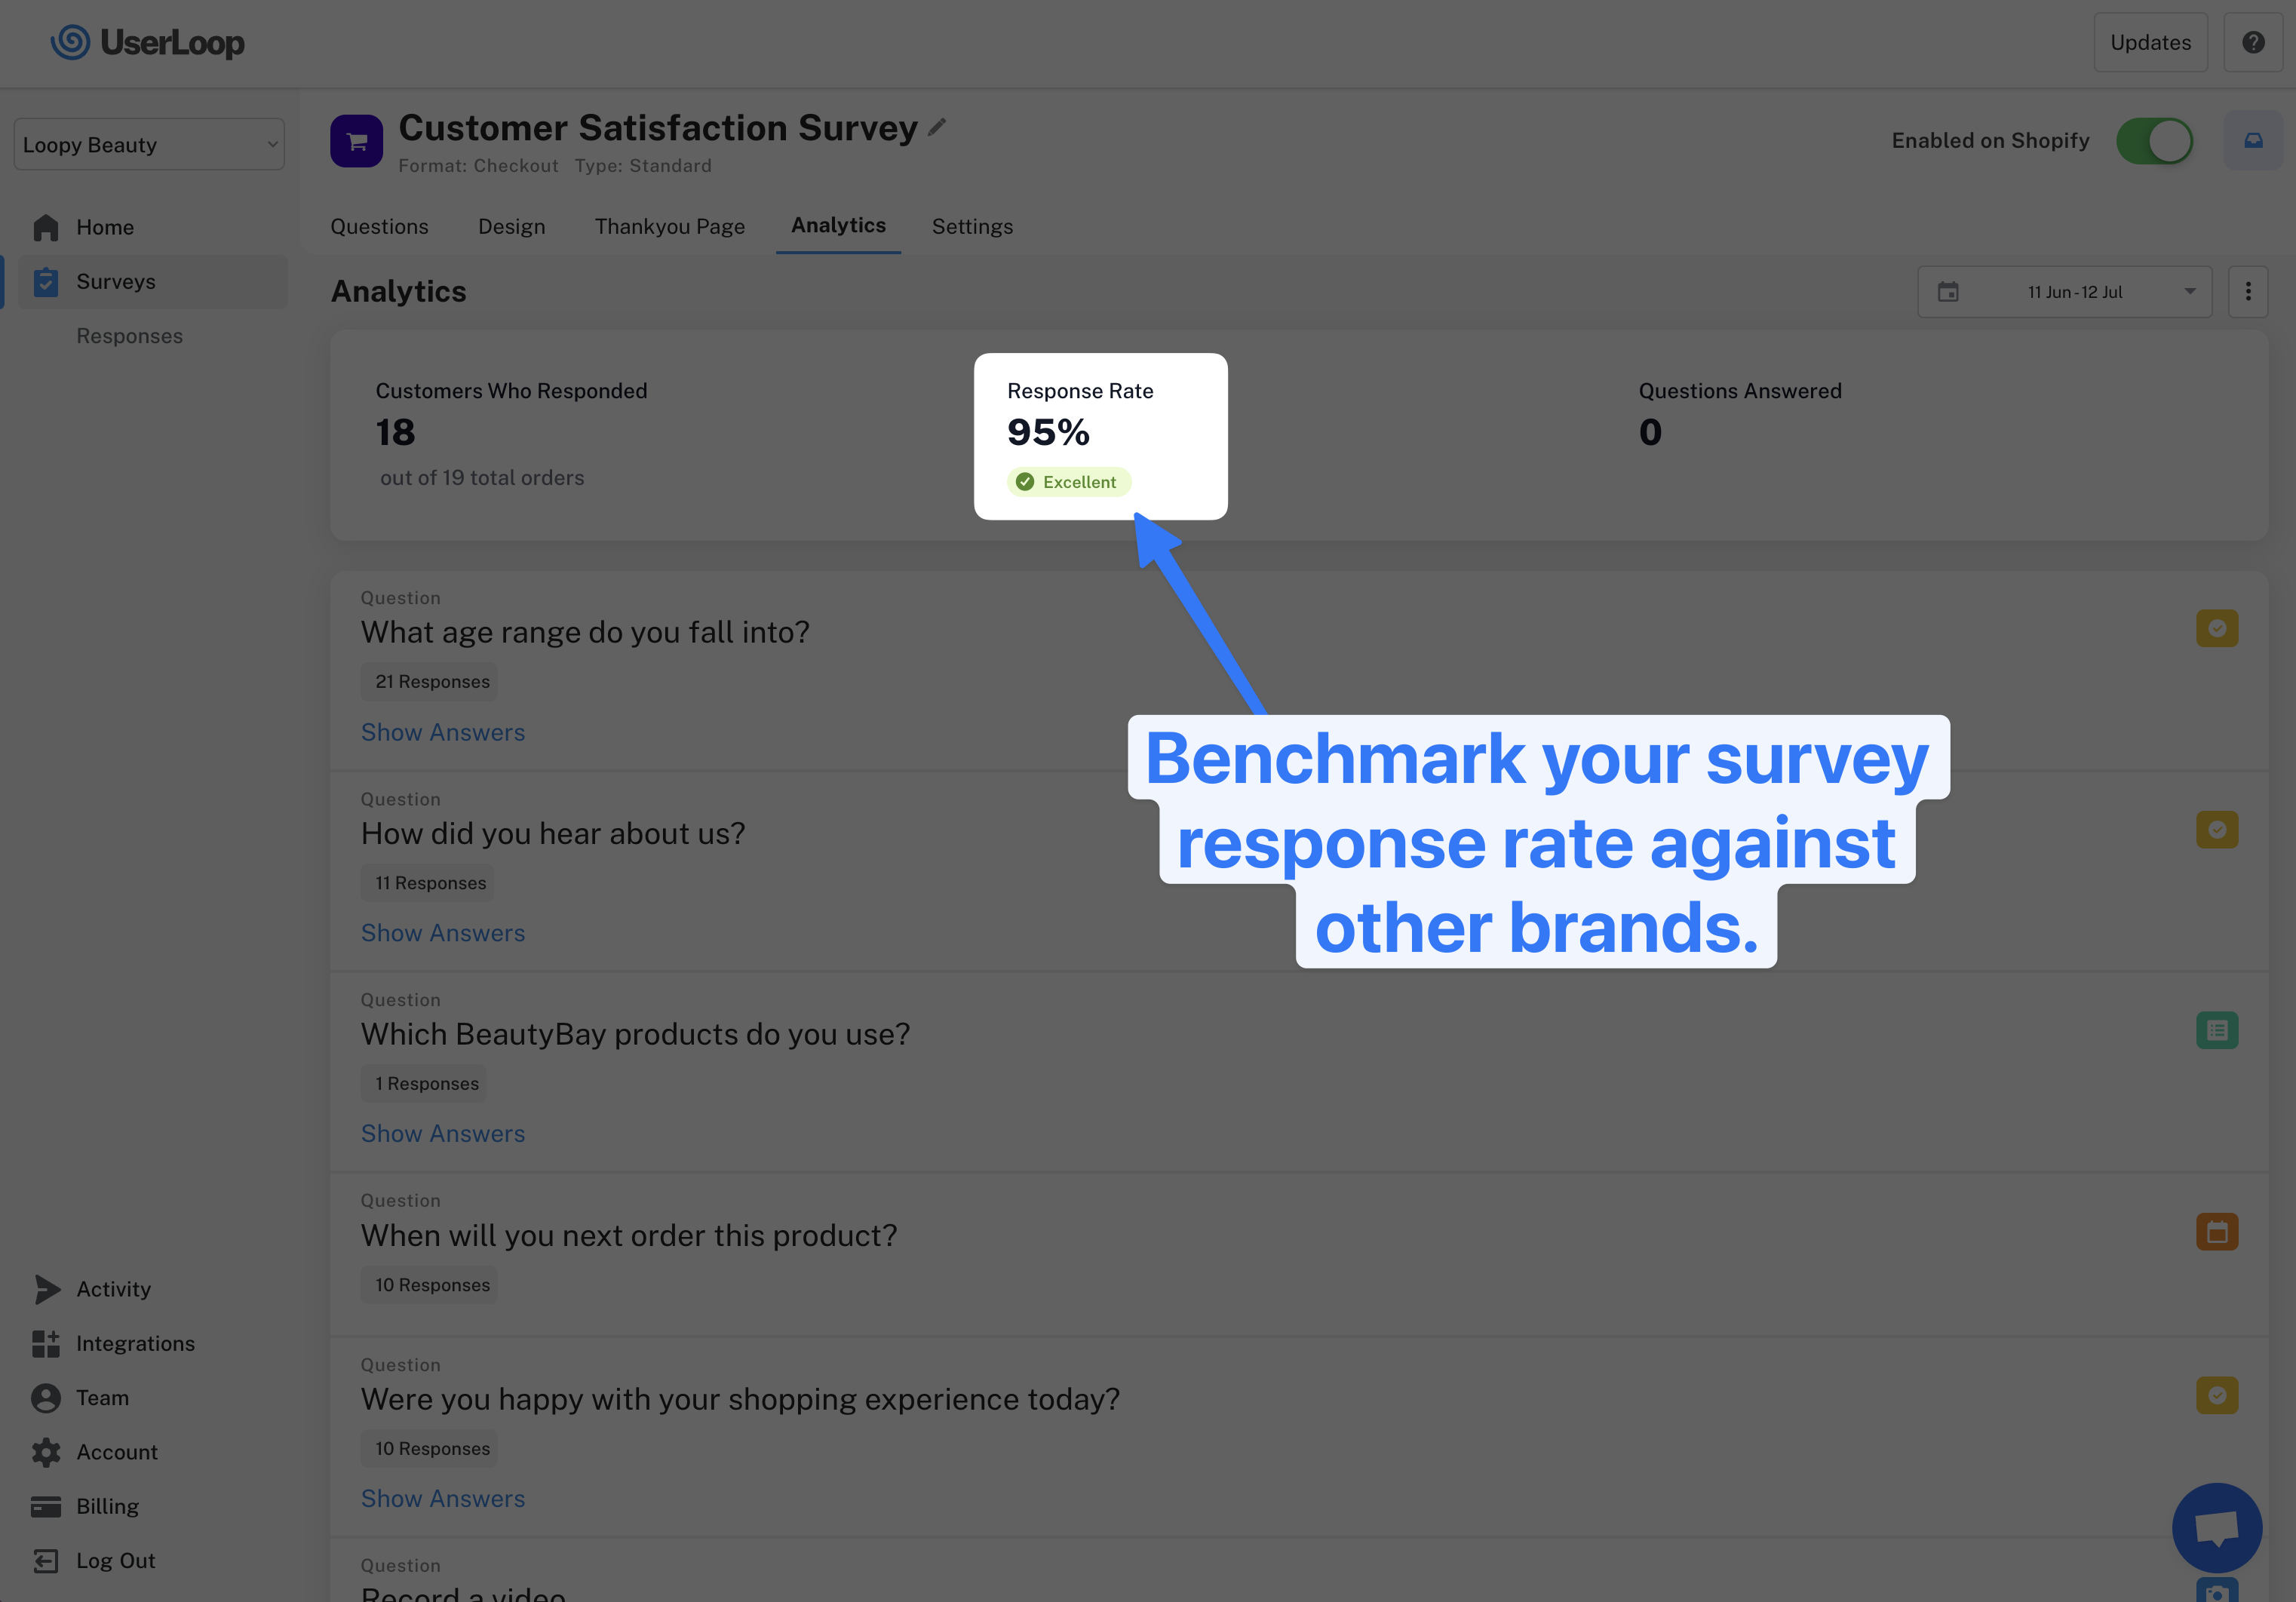
'Benchmarks' gives you the power to compare your brand's survey response rate against the current average across all brands on UserLoop. It offers an easy-to-understand rating of 'Excellent', 'Average', or 'Poor', providing an immediate snapshot of your performance relative to your peers.
Not only does this feature help you understand where you stand, but it also provides actionable insights on how to boost your response rate using other UserLoop features, such as our powerful Discount Generation tool.
Why We Launched 'Benchmarks'
We're not just launching new features for the sake of it. Our research provided some revealing insights into survey response behavior and the potential impact of incentives, all of which inspired the creation of 'Benchmarks'.
Our analysis based on millions of customer survey responses showed that incentives can dramatically impact response rates. We noticed a significant leap in response rates from 48% to over 75% when an incentive was introduced. This represents a substantial 26% increase, proving that incentives do indeed act as a powerful catalyst.
The influence of incentives didn't stop there. We saw an 80% surge in the number of customers who chose to complete the entire survey when an incentive was offered. Furthermore, when the incentive was communicated clearly from the start, we recorded an average surge in response rate of 30%.
We also discovered that on average, 8.5% of customers redeemed their coupons within a 30-day window, boosting customer lifetime value.
This data doesn't just reveal the power of incentives but also emphasizes the importance of regularly assessing your response rates against industry averages. Knowing where you stand can help you devise more effective strategies to engage your customers and gather meaningful feedback.
Make the Most of 'Benchmarks'
With the launch of 'Benchmarks', you now have the tool you need to stay ahead of the game. But as always, knowledge is power. Use the insights provided by 'Benchmarks' to fine-tune your survey strategies, experiment with different types of incentives, and communicate these rewards clearly right from the first question.
Remember, even incentives under 10% off can make a significant impact on response rates. For longer or more complex surveys, don't hesitate to offer more substantial incentives.
At UserLoop, we're excited to see how 'Benchmarks' will help you boost your survey response rates and improve your customer engagement strategies. We're only on day 2 of #Feedback week, so stay tuned for more exciting updates!
Don't miss out on the chance to turn feedback into growth. If you're not already a UserLoop customer, you can sign up and start your free trial today!


The agentic growth toolkit for Shopify
Ask your customers anything
UserLoop talks to your customers at scale with surveys and contests that feed one AI-queryable dataset. AI does the setup and the analysis.
- SurveysFind out why customers buy: checkout, email, link & QR.
- ContestsGiveaways that grow your list and social following.
Free plans on both apps · live in minutes